
Figures & data
Figure 1 Go/no-go task.
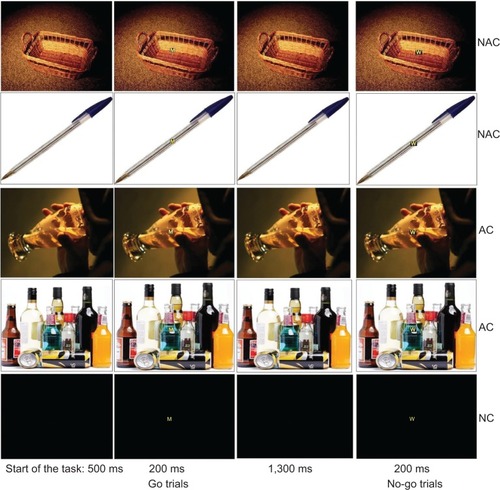
Table 1 Clinical characteristics of patients and controls, presented as means ± standard deviation
Table 2 Reaction times (RTs) to “go” stimuli, error rates, go, no-go, and P3d amplitudes in patients and controls, presented as means ± standard deviation
Figure 2 Original go/no-go P3 waves in the patient and control groups and resulting P3d waves at the FC1, FC2, and Cz sites.
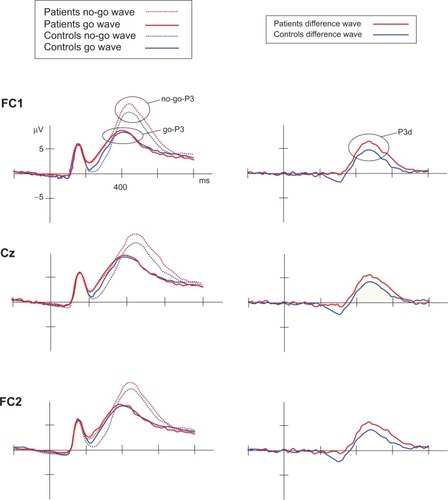
Table 3 Clinical characteristics of relapsers and nonrelapsers in our study, presented as means ± standard deviation
Figure 3 (A) Grand averages of the P3-difference waveforms between go and no-go trials in control, relapser, and nonrelapser groups. Computation of the P3d, ie, the mean difference wave (go P3 wave subtracted from the no-go P3 wave) for control, relapser, and nonrelapser groups at the FC1, Cz, and FC2 sites. The red line represents the relapser group’s mean wave, whose amplitude was greater than the nonrelapser (blue line) and control groups (green line). (B) Mean individual P3d amplitudes in patient group. Mean difference wave (go P3 wave subtracted from the no-go P3 wave) for each patient derived from the computation of the six electrode sites (FC1, FC2, Cz, CP1, CP2, and Pz) and the three contexts (nonalcohol-related background pictures [NAC], two alcohol-related background pictures [AC], neutral black background [NC]) collapsed as a function of their abstinence status at 3-month follow-up: relapsers are represented in red, and nonrelapsers are represented in blue.
![Figure 3 (A) Grand averages of the P3-difference waveforms between go and no-go trials in control, relapser, and nonrelapser groups. Computation of the P3d, ie, the mean difference wave (go P3 wave subtracted from the no-go P3 wave) for control, relapser, and nonrelapser groups at the FC1, Cz, and FC2 sites. The red line represents the relapser group’s mean wave, whose amplitude was greater than the nonrelapser (blue line) and control groups (green line). (B) Mean individual P3d amplitudes in patient group. Mean difference wave (go P3 wave subtracted from the no-go P3 wave) for each patient derived from the computation of the six electrode sites (FC1, FC2, Cz, CP1, CP2, and Pz) and the three contexts (nonalcohol-related background pictures [NAC], two alcohol-related background pictures [AC], neutral black background [NC]) collapsed as a function of their abstinence status at 3-month follow-up: relapsers are represented in red, and nonrelapsers are represented in blue.](/cms/asset/a2e101ea-2e2f-4cfe-8967-b1e879aa96ed/dndt_a_61475_f0003_c.jpg)
Table 4 Reaction times (RTs) to “go” stimuli, error rates, and P3d amplitudes in nonrelapsers and relapsers, presented as means ± standard deviation
Table 5 Multiple hierarchical regression analysis examining predictors of relapse after the 3-month follow-up period
Table 6 Multivariate Cox regression analysis with stepwise backward selection examining time to relapse within the 3-month follow-up period