
Figures & data
Table 1 Main demographic variables among five grades of junior college students
Figure 1 Comparisons of SHAI total scores and two subscale scores among five groups.
Notes: (A) SHAI total scores. SHAI total scores of grade 2 and grade 5 compared to other grades, respectively, *P<0.05; **P<0.01. (B) SHAI-IL scores. SHAI-IL scores of grade 2 compared to other grades *P<0.05; **P<0.01; ***P<0.001. SHAI-IL scores of grade 3 compared to grade 5, #P<0.05. (C) SHAI-NC scores. SHAI-NC scores of grade 1 compared to other grades, *P<0.05; ***P<0.001. SHAI-NC scores of grade 2 compared to grade 5, #P<0.05.
Abbreviations: SHAI, Short Health Anxiety Inventory; SHAI-IL, SHAI Illness Likelihood subscale; SHAI-NC, SHAI Negative Consequences subscale.
Abbreviations: SHAI, Short Health Anxiety Inventory; SHAI-IL, SHAI Illness Likelihood subscale; SHAI-NC, SHAI Negative Consequences subscale.
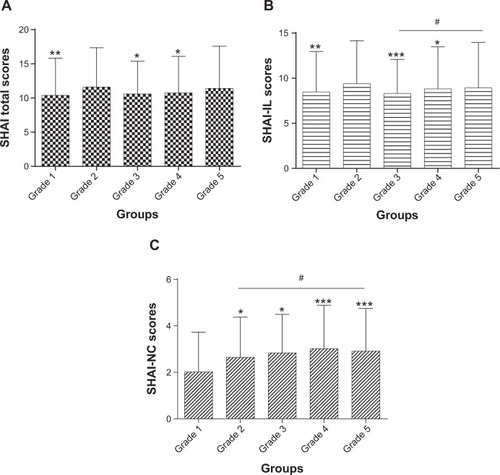
Figure 2 Comparisons of CSLSS total scores and subscale scores among five groups.
Notes: (A) CSLSS total scores. CSLSS total scores of grade 5 compared to other grades, *P<0.05; **P<0.01; ***P<0.001. (B) CSLSS-OS scores of grade 5 compared to other grades, *P<0.05; **P<0.01; ***P<0.001. (C) CSLSS-SS scores of grade 5 compared to other grades, *P<0.05; **P<0.01.
Abbreviations: CSLSS, Life Satisfaction Scales Applicable to College Students; CSLSS-OS, CSLSS Objective Satisfaction subscale; CSLSS-SS, CSLSS Subjective Satisfaction subscale; SD, standard deviation.
Abbreviations: CSLSS, Life Satisfaction Scales Applicable to College Students; CSLSS-OS, CSLSS Objective Satisfaction subscale; CSLSS-SS, CSLSS Subjective Satisfaction subscale; SD, standard deviation.
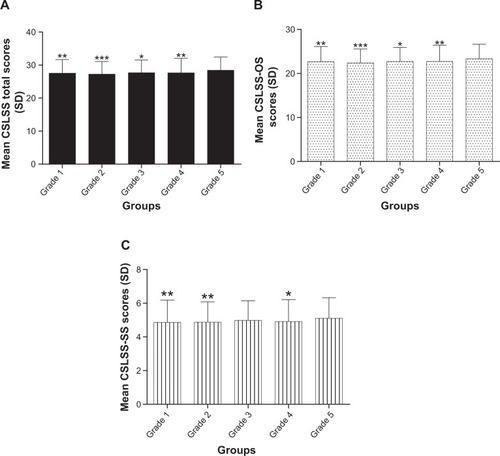
Figure 3 Comparisons of EPQ scores among five grades.
Notes: (A) EPQ-E scores. EPQ-E scores of grade 2 compared to other groups, **P<0.01; ***P<0.001; EPQ-E scores of grade 3 compared to other grades, ##P<0.01. (B) EPQ-P scores. EPQ-P scores of grade 1 compared to other grades, *P<0.05; ***P<0.001; EPQ-P scores of grade 2 compared to other grades, ###P<0.001. (C) EPQ-N scores. EPQ-N scores of grade 1 compared to other grades, **P<0.01; ***P<0.001. EPQ-N scores of grade 2 compared to grade 4, ##P<0.01. (D) EPQ-L scores. EPQ-L scores of grade 1 compared to grade 4, *P<0.05.
Abbreviations: EPQ, Eysenck Personality Questionnaire; EPQ-E, EPQ Extraversion subscale; EPQ-L, EPQ Truthfulness subscale; EPQ-N, EPQ Neuroticism subscale; EPQ-P, EQP Psychoticism subscale; SD, standard deviation.
Abbreviations: EPQ, Eysenck Personality Questionnaire; EPQ-E, EPQ Extraversion subscale; EPQ-L, EPQ Truthfulness subscale; EPQ-N, EPQ Neuroticism subscale; EPQ-P, EQP Psychoticism subscale; SD, standard deviation.
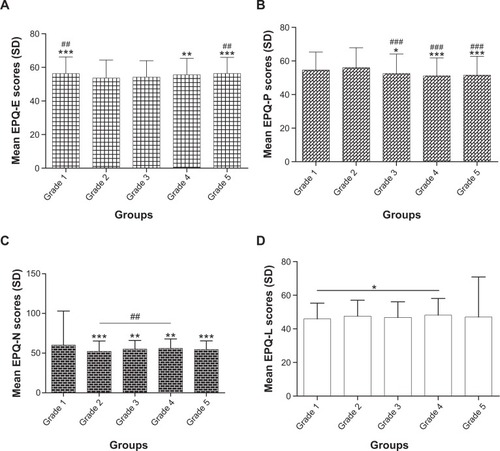
Figure 4 Comparisons of TAS-20 total scores and subscale scores among five groups.
Notes: (A) TAS-20 total scores. TAS-20 total scores of grade 1, grade 2, and grade 5 compared to other grades, each ***P<0.001. (B) TAS-F1 scores of grade 1 compared to other grades, ***P<0.001; TAS-F1 scores of grade 2 compared to other grades, ##P<0.01; ###P<0.001. TAS-F1 scores of grade 4 compared to grade 5, $P<0.05. (C) TAS-F2 scores of grade 1 compared to other grades, **P<0.01; ***P<0.001; TAS-F2 scores of grade 2 compared to other grades, ##P<0.01; ###P<0.001. (D) TAS-F3 scores of grade 1 and grade 5 compared to other grades, each ***P<0.001.
Abbreviations: TAS-20, Toronto Alexithymia Scale; TAS-F1, difficulties identifying and distinguishing among feelings; TAS-F2, difficulties describing or communicating feelings; TAS-F3, externally oriented thinking.
Abbreviations: TAS-20, Toronto Alexithymia Scale; TAS-F1, difficulties identifying and distinguishing among feelings; TAS-F2, difficulties describing or communicating feelings; TAS-F3, externally oriented thinking.
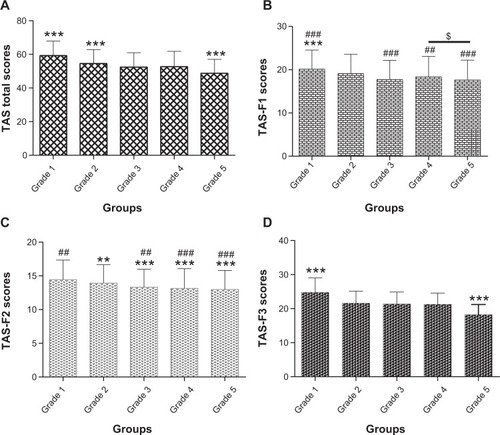
Table 2 Pearson correlation coefficients between SHAI total and subscale scores with related measures
Table 3 Regression analysis examining predictors of SHAI total