
Figures & data
Table 1 Summary of structural models
Figure 1 (A) Distribution of CSF p-tau181P/Aβ1–42 on log scale in CN, LMCI, and mild AD subjects. The curves and the vertical line are the density of the subpopulations and threshold of 0.147 (untransformed value), based on the CSF mixture model. (B) The observed density for log CSF p-tau181P/Aβ1–42 in CN, LMCI, and AD subjects is overlaid on top of the estimated threshold of −1.92 (natural log transformed value). (C) Mean CDR–SB profiles by biomarker status, in LMCI subjects. (D) Mean CDR–SB profiles by biomarker status, in mild AD subjects.
Abbreviations: Aβ1–42, 42 amino acid isoform of amyloid beta peptide; AD, Alzheimer’s disease; CN, cognitively normal; CSF, cerebrospinal fluid; LMCI, late mild cognitive impairment; p-tau181P, tau protein phosphorylated at position threonine 181; SE, standard error.
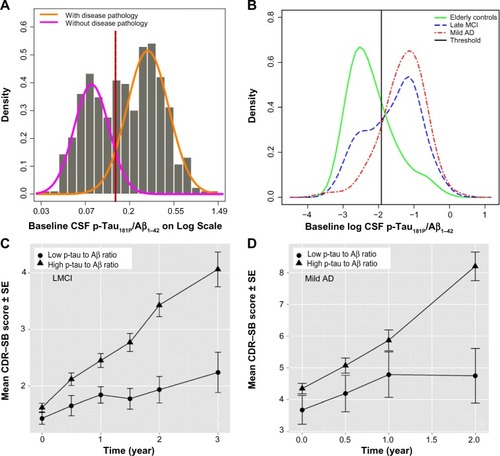
Figure 2 Baseline covariates influencing CDR–SB disease progression rate in subjects with CSF p-tau181P/Aβ1–42>0.147.
Abbreviations: Aβ1–42, 42 amino acid isoform of amyloid beta peptide; AD, Alzheimer’s disease; ADNI, Alzheimer’s Disease Neuroimaging Initiative; CDR–SB, Clinical Dementia Rating Scale–Sum of Boxes; CSF, cerebrospinal fluid; LMCI, late mild cognitive impairment; p-tau181P, tau protein phosphorylated at position threonine 181; SE, standard error; Trails A test, Trail-Making Test part A.
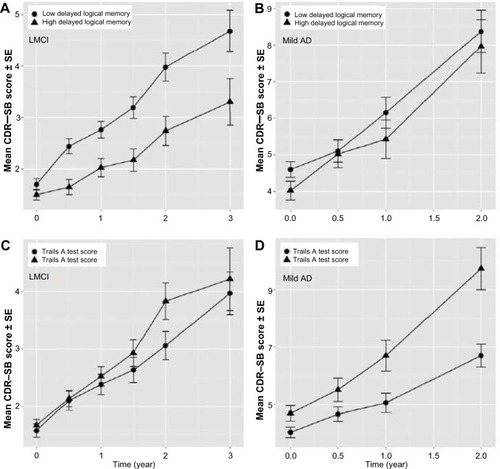
Table 2 Final CDR–SB disease progression model parameters
Table 3 Parameter estimates from the dropout model
Figure 3 Stratified visual predictive check.
Abbreviations: Aβ1–42, 42 amino acid isoform of amyloid beta peptide; AD, Alzheimer’s disease; LMCI, late mild cognitive impairment; p-tau181P, tau protein phosphorylated at position threonine 181; CDR–SB, Clinical Dementia Rating Scale–Sum of Boxes.
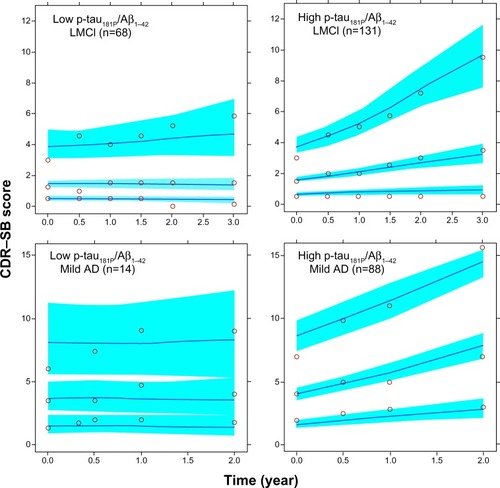
Figure S1 Overview of the model building process.
Note: δ is a small noise used for rescaling all the data to move the boundary observations slightly within the edges.
Abbreviation: VPC, visual predictive check.
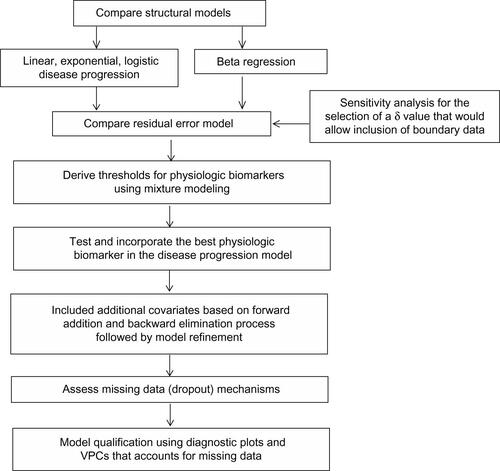
Figure S2 (A) 1-year change scores vs disease severity on CDR–SB scale for mild AD and LMCI subjects. The line and gray areas represent the loess smoother and the 95% confidence bands. (B) The loess smoother and confidence bands are shown alone to allow illustration of the inverted U-shaped relationship between progression rate and disease severity.
Notes: The calculations are based on the 12-month interval method. The difference in scores between a pair of points separated by 12 months was computed (later score minus the earlier baseline score) and plotted against the baseline score for that pair. If subjects contributed more than one pair of scores separated by 12 months, those subjects generated more than one data point for the plot (the legend in Panel A indicates the year of the study during which the pair of scores were generated). Due to the statistical issues associated with subjects contributing different numbers of observations and the correlations among data points from one subject, these graphs are used only for diagnostic/exploratory purposes.
Abbreviations: AD, Alzheimer’s disease; LCMI, late mild cognitive impairment; CDR–SB, Clinical Dementia Rating Scale–Sum of Boxes; vs, versus.
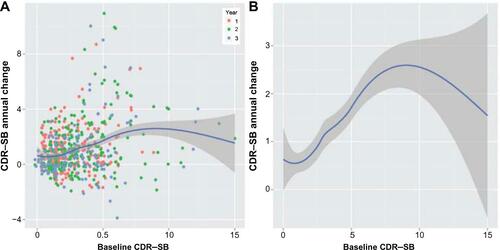
Figure S3 Results of the exploratory analysis for missing data: mean observed scores as a function of different study discontinuation times.
Abbreviations: AD, Alzheimer’s disease; CDR–SB, Clinical Dementia Rating Scale–Sum of Boxes; LMCI, late mild cognitive impairment.
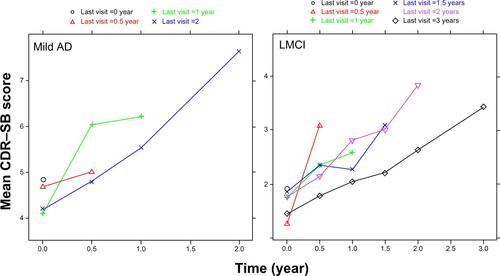
Figure S4 Goodness-of-fit plots.
Notes: The observed data versus the population and individual predictions are shown in the top panels. The bottom left panel shows the absolute values of the individually weighted residuals, and the bottom right panel shows the population conditional weighted residuals. Individual data points are indicated by blue circles; the red lines are loess smoothers, the black diagonal lines (top panels) represent the lines of identity, and the black horizontal line (bottom right) indicates the ordinate value of 0.
Abbreviation: iWRES, the individually weighted residuals.
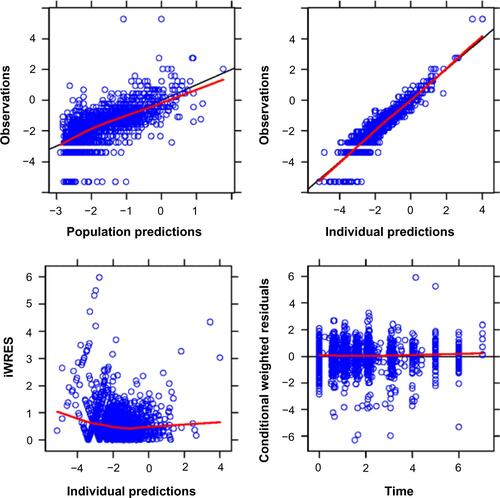
Figure S5 VPC with and without dropout.
Notes: In the left panel, simulations were performed with the combined disease progression plus dropout model. In the right panel the simulations were performed without the dropout model. The black arrow in the right panel indicates that predictive performance is hampered at later times (where scores are high and probability of dropout higher) when dropouts are not accounted.
Abbreviations: Aβ1–42, 42 amino acid isoform of amyloid beta peptide; CDR–SB, Clinical Dementia Rating Scale–Sum of Boxes; LMCI, late mild cognitive impairment; p-tau181P, tau protein phosphorylated at position threonine 181; VPC, visual predictive check.
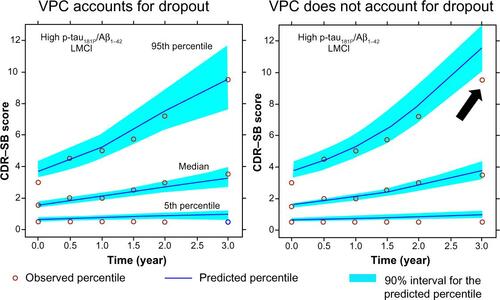
Table S1 Boundary data handling: results of sensitivity analysisTable Footnote*
Table S2 Parameters of the mixture models fitted to the baseline CSF biomarker data and hippocampal volume in the ADNI-1 CN, LMCI, and mild AD subjects
Table S3 Mean baseline CDR–SB for the subgroups, based on the statistically significant covariates for the baseline parameter in the disease progression model