
Figures & data
Table 1 Content of the psychoeducation sessions
Table 2 Baseline patient characteristics
Figure 1 Patient disposition.
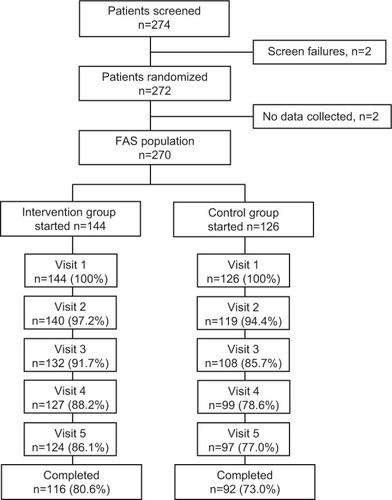
Table 3 Discontinuations during the study
Figure 2 Pharmacologic treatment usage during the study.
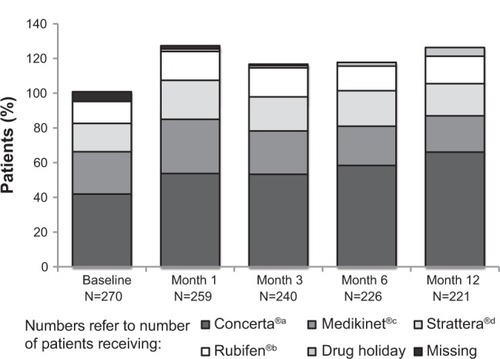
Figure 3 Estimated time to treatment discontinuation (Kaplan–Meier).
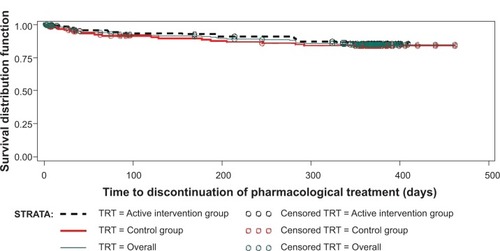
Table 4 Cox proportional hazards model for time until treatment discontinuation ≤12 months; analysis of covariates
Figure 4 Change in ADHD-RS-IV Parent:Inv total score (least squares mean estimate) for the psychoeducation and control groups.
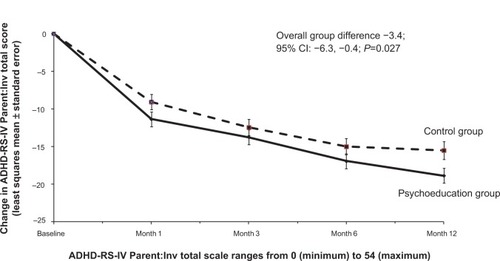
Figure 5 Change in CGI-ADHD-S total score (least squares mean estimate) for the psychoeducation and control groups.
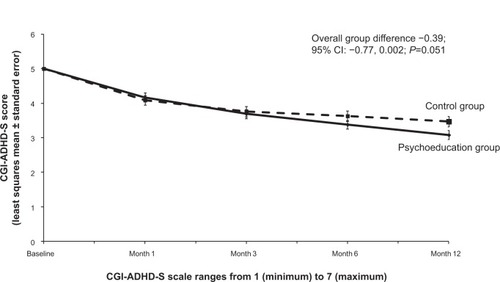
Figure 6 Drug usage patterns during the study.
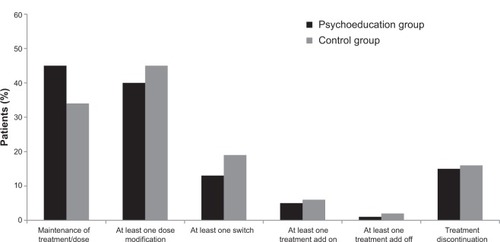
Table 5 Protocol-emergent adverse events reported by ≥5% of patients