Figures & data
Table 1 Description of sleep duration and subjective psychological well-being, separated by: CH and N; age groups (I, 10–11 year olds; II, 12–13 year olds; III, 14–15 year olds); and the three measurement time points (T1, T2, and T3)
Table 2 Correlations between sleep duration and subjective psychological well-being, separated by the three age groups (I, 10–11 year olds; II, 12–13 year olds; III, 14–15 year olds) and three measurement time points (T1, T2, and T3)
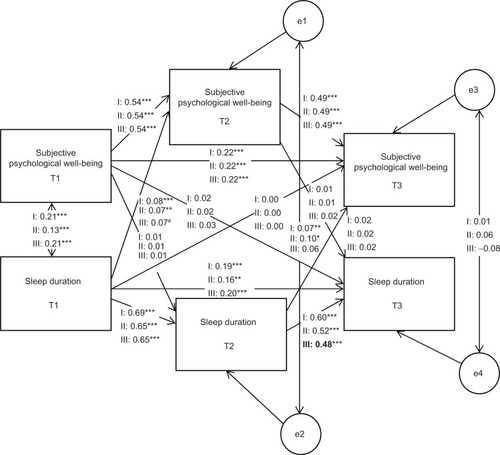
Figure 1 Longitudinal path model.
Notes: Standardized estimates are displayed. Bold letters indicate that this path is significantly different for the respective age group. Fit indices for the displayed model set all paths equal across age groups, except for the path between sleep duration at T2 and sleep duration at T3 for the oldest age group: χ2=28.01; df=23; P=0.215; RMSEA =0.007. Model comparison of the displayed model with the model setting all paths equal across age groups: χ2=23.35; df=1: P<0.001. #P=0.08; *P<0.05; **P<0.01; ***P<0.001.
Abbreviations: RMSEA, root mean square error of approximation; I, 10–11 year olds; II, 12–13 year olds; III, 14–15 year olds; e, error term.
Abbreviations: RMSEA, root mean square error of approximation; I, 10–11 year olds; II, 12–13 year olds; III, 14–15 year olds; e, error term.