Figures & data
Table 1 Demographic and clinical characteristics of patients versus healthy controls
Figure 1 Box plot of the differences in serum nerve growth factor (NGF) levels among the different groups.
Notes: The P-values of the comparisons between the groups were calculated by the nonparametric Mann–Whitney test. *P<0.05.
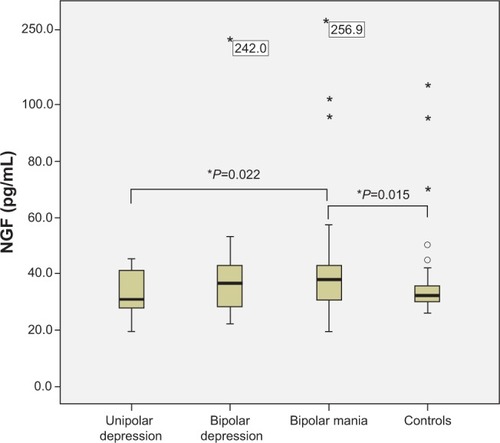
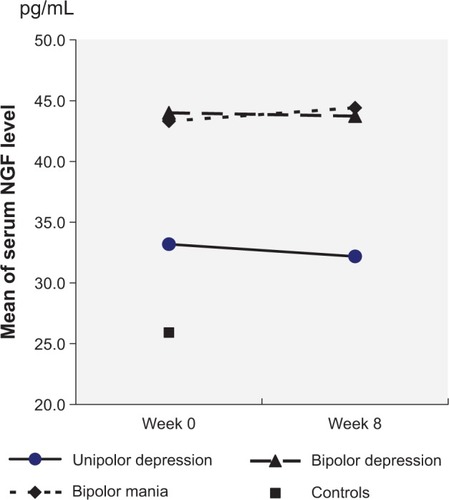
Figure 2 Mean nerve growth factor (NGF) value variations after 8 weeks of treatment of patients with unipolar depression, bipolar depression, or bipolar mania.