
Figures & data
Table 1 Participants’ characteristics
Figure 1 Path diagram depicting the correlated two-factor solution (Model B) of the short French version of the Questionnaire on Smoking Urges.
Notes: *P<0.01. For each item, e represents the error measurement related to that specific item.
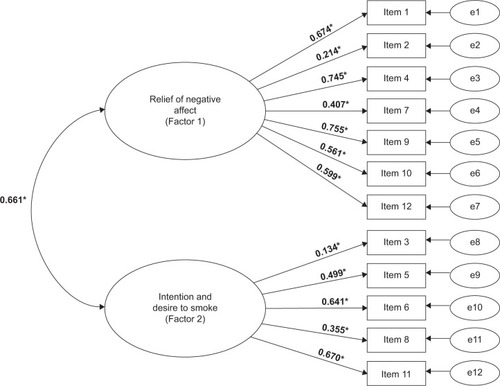
Table 2 Fit index values for the different tested models
Table 3 Pairwise correlations between variables of the study
Table S1 QSU-12 items