
Figures & data
Figure 1 The a-wave of the electroretinogram reflects the activity of photoreceptors; the b-wave indicates the activity of the amacrine, horizontal, bipolar, and Müller cells. Implicit time refers to the time occurring between the initiation of the light stimulation (flash) and the peak of a- and b-waves. The a-wave amplitude was measured from baseline to a-wave trough; the b-wave amplitude was measured from a-wave trough to b-wave peak.
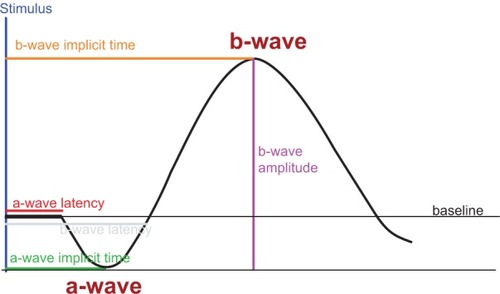
Figure 2 Flowchart of study procedures.
Abbreviation: ERG, electroretinogram.
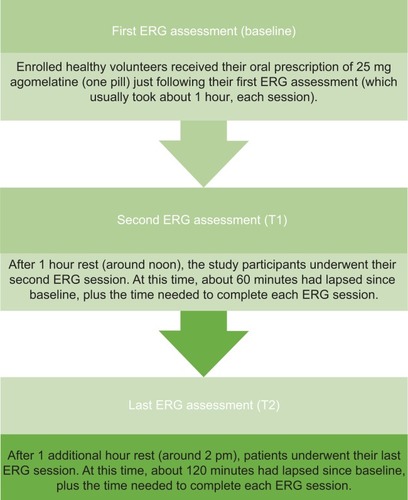
Table 1 Slightly, yet statistically, significant trends of increase of b-wave parameters