
Figures & data
Figure 1 Default mode network in adults and infants.
Abbreviation: FWE, familywise error rate.
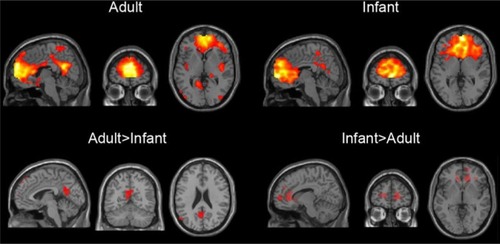
Figure 2 Regional differences in resting-state networks in infants and adults.
Abbreviations: ns, nonsignificant; FWE, familywise error rate.
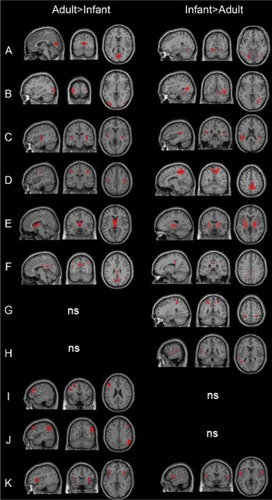
Figure 3 Higher-level connectivity in infants and adults.
Abbreviations: RSN, resting-state network; ICA, independent components analysis; FDR, false discovery rate.
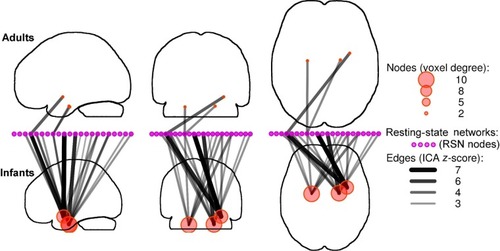
Figure S1 Consistency of infant resting-state networks compared with adult template resting-state networks.
Notes: Combined independent components analysis, using both infant and adult subjects, resulted in networks that closely resembled networks from an independent components analysis using the infant subjects only. In both cases, many networks showed spatial distributions matching resting-state network templates.Citation1 (A) V1, (B) V2, (C) auditory, (D) sensorimotor, (E) basal ganglia, (F) precuneus, (G) visuospatial, (H) language, (I) left executive control, (J) right executive control, and (K) anterior salience.
Abbreviations: RSN, resting-state network; ICA, independent components analysis.
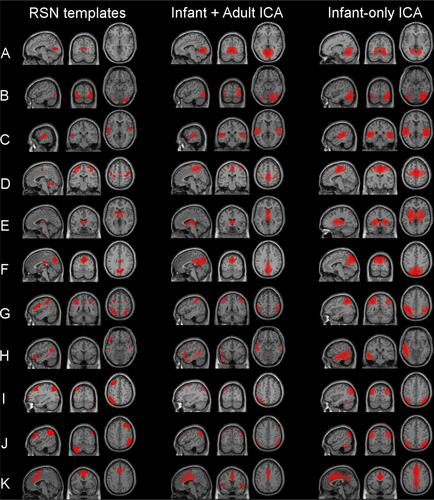
Table S1 Group differences in resting-state networks