Figures & data
Table 1 Demographic variables for each group
Table 2 Means and standard deviations for the PCSI and the MMSE scores by dementia status and literacy status
Table 3 Cut-off points, sensitivity, specificity, and correct classification rate for PCSI subtest scores and MMSE score
Figure 1 Receiver operating characteristic curve analysis of the PCSI and MMSE scores for detecting dementia.
Abbreviations: MMSE, Mini Mental State Examination; PCSI, Pictorial Cognitive Screening Inventory.
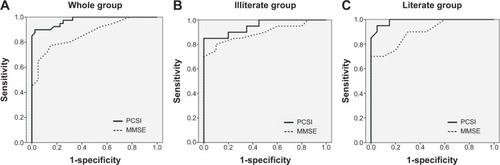
Table 4 Cut-off points, sensitivity, specificity, and correct classification rate for PCSI composite score and MMSE score
Figure S1 Examples of pictorial stimuli in the pictorial memory test: flower (left) and umbrella (right).