
Figures & data
Figure 1 Left dorsolateral prefrontal cortex.
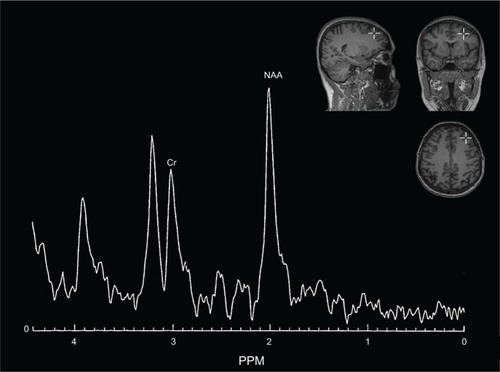
Figure 2 Left amygdala.

Table 1 Group characteristics
Figure 3 Box plots of NAA/Cr, showing baseline and endpoint in DLPFC and amygdala for all subjects. Shown are medians (squares), interquartile ranges (boxes), and nonoutlier range (whiskers).
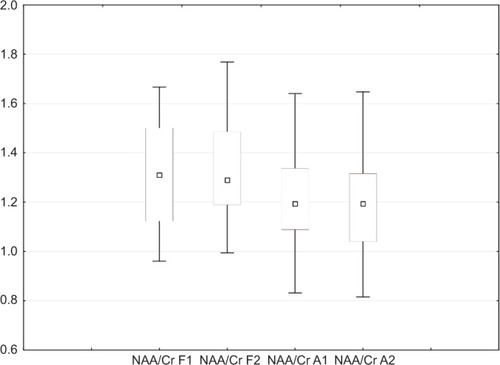
Figure 4 Box plots of NAA/Cr in responders and nonresponders to antidepressant treatment showing baseline and endpoint in DLPFC and amygdala. Shown are medians (squares), interquartile ranges (boxes), and nonoutlier range (whiskers).
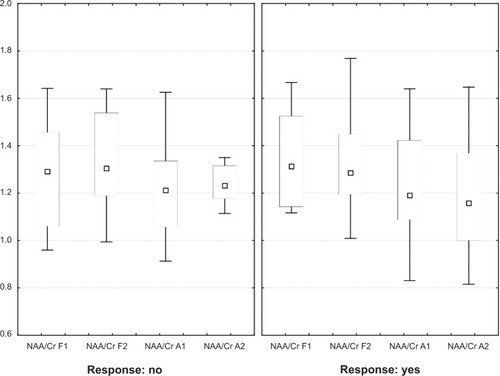
Table 2 Changes in scales and NAA/Cr ratios from baseline to endpoint
Table 3 Correlations of changes in scale scores with changes in NAA/Cr ratios from baseline to endpoint
Table 4 Correlations of changes in scale scores with changes in NAA/Cr ratios from baseline to endpoint in responders and nonresponders