Figures & data
Figure 1 Exposure to 10 μg/mL lipopolysaccharide (LPS) for 30 minutes elevated interleukin (IL)-1β (A) and tumor necrosis factor (TNF)-α (B) concentration in brain slices.
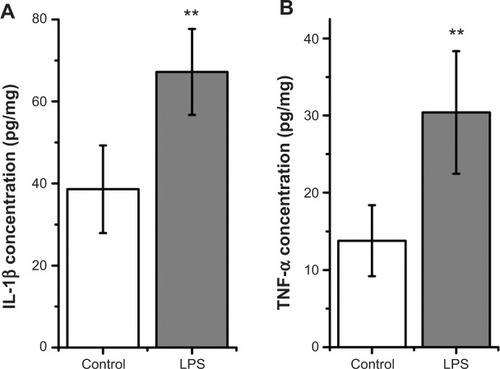
Figure 2 Lipopolysaccharide (LPS) facilitated epileptiform discharges.
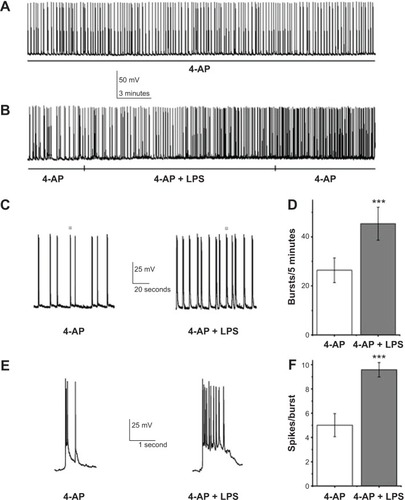
Figure 3 Lipopolysaccharide (LPS) enhanced evoked excitatory postsynaptic currents (eEPSCs) but did not modify evoked inhibitory postsynaptic currents (eIPSCs) in hippocampal CA1 pyramidal neurons.
Abbreviation: ms, millisecond.
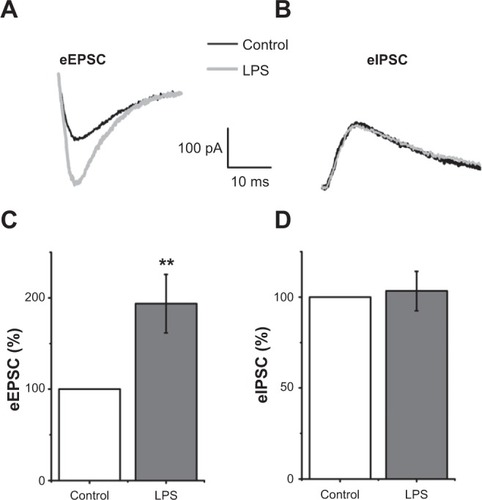
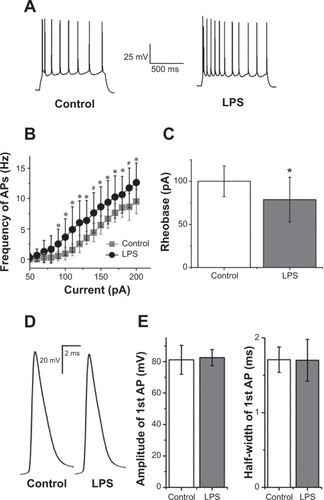
Figure 4 Lipopolysaccharide (LPS) enhanced excitability of hippocampal CA1 pyramidal neurons.
Notes: (A) Representative traces showed neuronal responses to a 190 pA depolarizing current for 1 second in control artificial cerebrospinal fluid (Left) and 30 minutes after LPS was added (Right). Note the enhanced neuronal excitability in the presence of LPS. (B) Graph of action potential (AP) frequency shown in mean ± standard deviation for control condition and LPS exposure. The mean action potential frequency significantly increased after LPS exposure. *,#Significant differences (P<0.05 and P<0.01, respectively) compared LPS with control conditions. (C) Reduction of rheobase was significant 30 minutes after LPS application (P<0.05; n=8; paired-sample Student’s t-test). (D) Representative traces showed the first action potential evoked by rheobase current in control artificial cerebrospinal fluid and 30 minutes after LPS was added. (E) Summary data showed there were not significant differences in amplitude and half-width of the first action potential under the rheobase current injection (both P>0.05; n=8; paired-sample Student’s t-test). Holding potential was −70 mV in these processes.