
Figures & data
Table 1 Clinical demographic characteristics by depression tertiles (n=86)
Figure 1 Mean serum kynurenine/tryptophan (K/T) ratios in low (0–6), medium (7–16), and high (17–47) Center for Epidemiological Studies Depression (CES-D) scale tertiles (n=86).
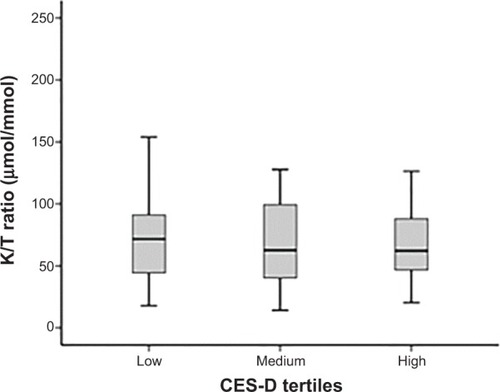
Table 2 Immunological assay resultsTable Footnote*
Figure 2 Mean serum cytokine/IL-10 ratios in low (0–6), medium (7–16), and high (17–47) Center for Epidemiological Studies Depression (CES-D) scale tertiles; n=53 for each panel.
Notes: (A) Mean serum IL-6/IL-10; (B) mean serum IL-18/IL-10; (C) mean serum IFNγ/IL-10; (D) mean serum TNF/IL-10; (E) mean serum IL-1β/IL-10 ratio in low (0–6), medium (7–16), and high (17–47) CES-D scale tertiles. *P<0.0005; †P<0.05.
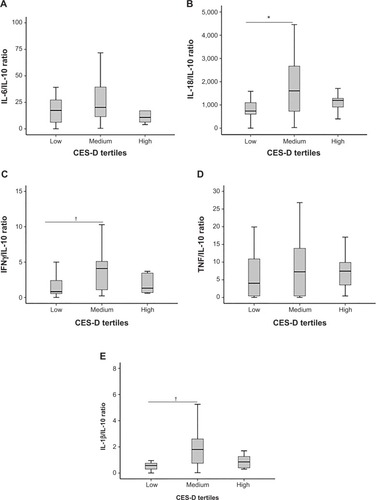
Table 3 Differences between cytokines and cytokine ratios by CES-D tertiles (n=53)