Figures & data
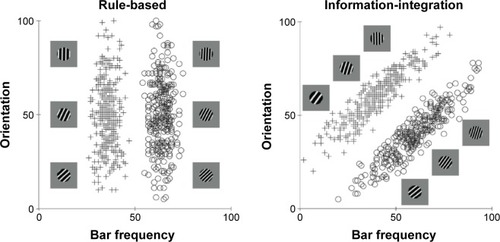
Figure 1 Examples of rule-based and information-integration category structures.
Notes: Each stimulus is a sine wave disk that varies across trials in the number of bars per disk (or bar narrowness) and bar orientation. For each task, three illustrative category A and category B stimuli are shown. The plus signs and open circles denote the specific values of all stimuli used in each task. In the rule-based task, only the number of bars per disk carries diagnostic category information, so the optimal strategy is to respond with a one-dimensional bar narrowness rule (thin vs thick). In the information-integration task, both the number of bars per disk and bar orientation carry useful but insufficient category information. The optimal strategy requires integrating information from both dimensions in a way that is impossible to describe verbally.