
Figures & data
Figure 1 Flow chart of the recruitment process.
Abbreviations: ADHD, attention-deficit/hyperactivity disorder; C, combined subtype; DISC-IV, Diagnostic Interview Schedule for Children Version IV; HI, hyperactivity– impulsivity subtype; IA, inattentive subtype; SWAN, Strengths and Weaknesses of ADHD-Symptoms and Normal-Behaviors questionnaire.
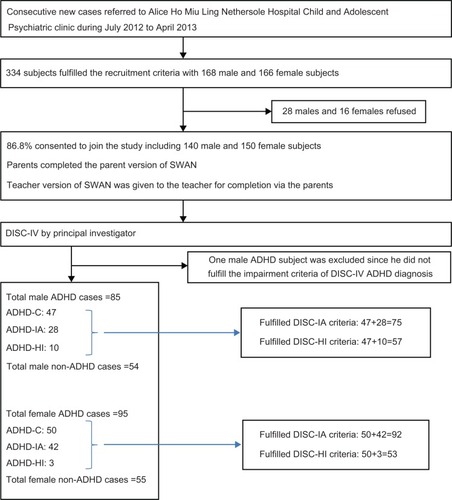
Table 1 Spearman Correlation between SWAN subscales scores and the respective categorical DISC diagnosis in inattentive and hyperactivity-impulsivity symptom domains in male and female subjects
Table 2 Pearson’s correlation between SWAN subscale scores and the respective criterion and symptom counts of DISC-IA and DISC-HI in male and female subjects
Table 3 Mean SWAN subscale scores and AUC in male and female subjects
Table 4 SWAN subscale cutoff score, SE, and SP in male and female subjects