Figures & data
Figure 1 Experimental timeline of this study.
Notes: Sham CUMS, without any treatment (for group C); Sham ECS (for group D), Sham MECS (for group P).
Abbreviations: CUMS, chronic unpredictable mild stresses (for groups D, P, E, and M); ECS, electroconvulsive shock (for group E); MECS, modified ECS (for group M); MWM, Morris water maze test; OFT, open field test; SPT, sucrose preference test; ×, sacrifice.
Abbreviations: CUMS, chronic unpredictable mild stresses (for groups D, P, E, and M); ECS, electroconvulsive shock (for group E); MECS, modified ECS (for group M); MWM, Morris water maze test; OFT, open field test; SPT, sucrose preference test; ×, sacrifice.
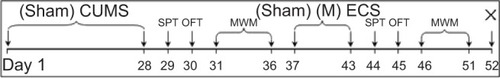
Figure 2 Sucrose preference in rats after ECS (or MECS) treatment.
Notes: Data are presented as the mean ± SE; **P<0.01 and ***P<0.001 versus group C; ###P<0.001 versus group D; P<0.001 versus group P. C represents control rats; D represents CUMS-pretreated rats that received sham ECS with normal saline pretreatment; P represents CUMS-pretreated rats that received sham ECS with propofol pretreatment; E represents CUMS-pretreated rats that received ECS with normal saline pretreatment; M represents CUMS-pretreated rats that received ECS with propofol pretreatment; n=10 in each group.
Abbreviations: CUMS, chronic unpredictable mild stresses; ECS, electroconvulsive shock; MECS, modified ECS; SE, standard error.
Abbreviations: CUMS, chronic unpredictable mild stresses; ECS, electroconvulsive shock; MECS, modified ECS; SE, standard error.
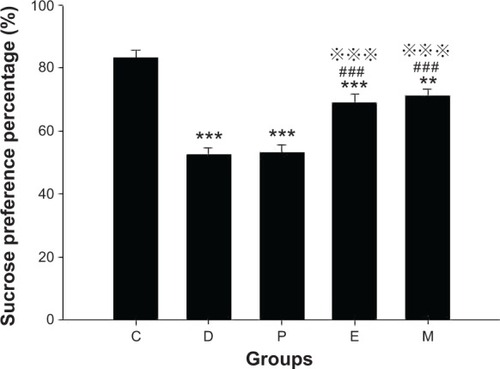
Figure 3 Indexes in open field test in rats after ECS (or MECS) treatment.
Notes: Distance (A); rearing number (B); time in the central zone (C). Data are presented as the mean ± SE. **P<0.01 and ***P<0.001 versus group C; ###P<0.001 versus group D; P<0.001 versus group P. C represents control rats; D represents CUMS-pretreated rats that received sham ECS with normal saline pretreatment; P represents CUMS-pretreated rats that received sham ECS with propofol pretreatment; E represents CUMS-pretreated rats that received ECS with normal saline pretreatment; M represents CUMS-pretreated rats that received ECS with propofol pretreatment; n=10 in each group.
Abbreviations: CUMS, chronic unpredictable mild stresses; ECS, electroconvulsive shock; MECS, modified ECS; s, seconds; SE, standard error.
Abbreviations: CUMS, chronic unpredictable mild stresses; ECS, electroconvulsive shock; MECS, modified ECS; s, seconds; SE, standard error.
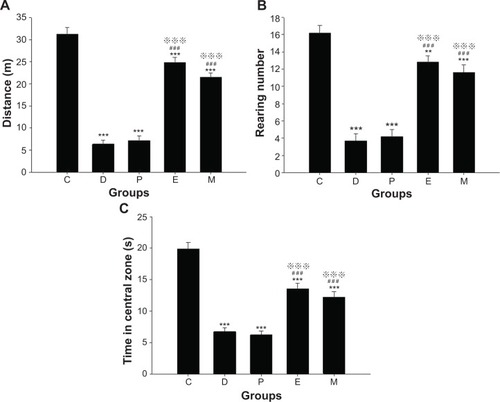
Figure 4 Learning and memory in Morris water maze test in rats after ECS (or MECS) treatment.
Notes: Evasive latency (A); division of different quarters in the test (B); time percentage in the platform quarter of each group (C); time percentage in each quarter in group C (D); time percentage in each quarter in group D (E); time percentage in each quarter in group P (F); time percentage in each quarter in group E (G); time percentage in each quarter in group M (H). Data are presented as the mean ± standard error; **P<0.01, ***P<0.001 versus group C or quarter NW; #P<0.05, ##P<0.01, and ###P<0.001 versus group D or quarter NE; P<0.05, P<0.01, and P<0.001 versus group P or quarter SW; ΔΔP<0.01, ΔΔΔP<0.001 versus group E. C represents control rats; D represents CUMS-pretreated rats that received sham ECS with normal saline pretreatment; P represents CUMS-pretreated rats that received sham ECS with propofol pretreatment; E represents CUMS-pretreated rats that received ECS with normal saline pretreatment; M represents CUMS-pretreated rats that received ECS with propofol pretreatment. • Represents platform; n=10 in each group.
Abbreviations: CUMS, chronic unpredictable mild stresses; ECS, electroconvulsive shock; MECS, modified ECS; NE, northeastern quarter; NW, northwestern quarter; SE, southeastern quarter; SW, southwestern quarter (ie, the platform quarter).
Abbreviations: CUMS, chronic unpredictable mild stresses; ECS, electroconvulsive shock; MECS, modified ECS; NE, northeastern quarter; NW, northwestern quarter; SE, southeastern quarter; SW, southwestern quarter (ie, the platform quarter).
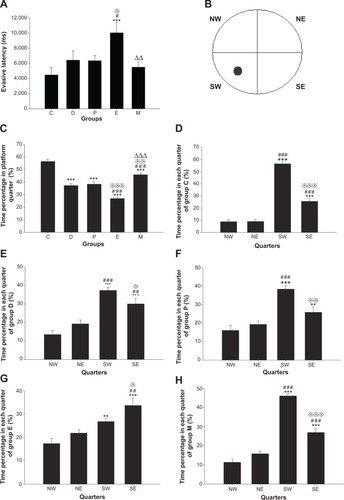
Figure 5 LTP in the CA1 region in hippocampus of rats after ECS (or MECS) treatment.
Notes: Original traces of fEPSP in each group (A); input/output curves in each group (B); the induction and maintenance of LTP (C); baseline fEPSP slope (D); relative fEPSP slope (E). Data are presented as the mean ± SE; *P<0.05, ***P<0.001 versus group C; #P<0.05, ###P<0.001 versus group D; P<0.05, P<0.001 versus group P; ΔΔΔP<0.001 versus group E. C represents control rats; D represents CUMS-pretreated rats that received sham ECS with normal saline pretreatment; P represents CUMS-pretreated rats that received sham ECS with propofol pretreatment; E represents CUMS-pretreated rats that received ECS with normal saline pretreatment; M represents CUMS-pretreated rats that received ECS with propofol pretreatment; n=5 in each group. aoriginal trace of baseline fEPSP; boriginal trace of fEPSP after HFS.
Abbreviations: CUMS, chronic unpredictable mild stresses; ECS, electroconvulsive shock; fEPSP, field excitatory postsynaptic potential; HFS, high frequency stimulation; LTP, long-term potentiation; MECS, modified ECS; SE, standard error.
Abbreviations: CUMS, chronic unpredictable mild stresses; ECS, electroconvulsive shock; fEPSP, field excitatory postsynaptic potential; HFS, high frequency stimulation; LTP, long-term potentiation; MECS, modified ECS; SE, standard error.
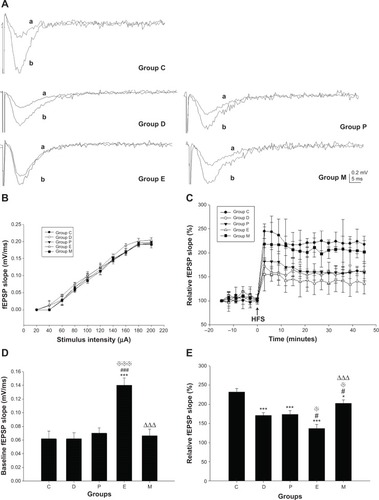
Figure 6 Hippocampal PSD-95 protein expression in rats after ECS (or MECS) treatment.
Notes: Western blot bands of PSD-95 and β-actin (A); relative expression of PSD-95 protein (B). Data are presented as the mean ± SE; ***P<0.001 versus group C; #P<0.05 versus group D; P<0.05 versus group P; ΔΔP<0.01 versus group E. C represents control rats; D represents CUMS-pretreated rats that received sham ECS with normal saline pretreatment; P represents CUMS-pretreated rats that received sham ECS with propofol pretreatment; E represents CUMS-pretreated rats that received ECS with normal saline pretreatment; M represents CUMS-pretreated rats that received ECS with propofol pretreatment; n=6 in each group.
Abbreviations: CUMS, chronic unpredictable mild stresses; ECS, electroconvulsive shock; MECS, modified ECS; PSD-95, postsynaptic density-95; SE, standard error.
Abbreviations: CUMS, chronic unpredictable mild stresses; ECS, electroconvulsive shock; MECS, modified ECS; PSD-95, postsynaptic density-95; SE, standard error.
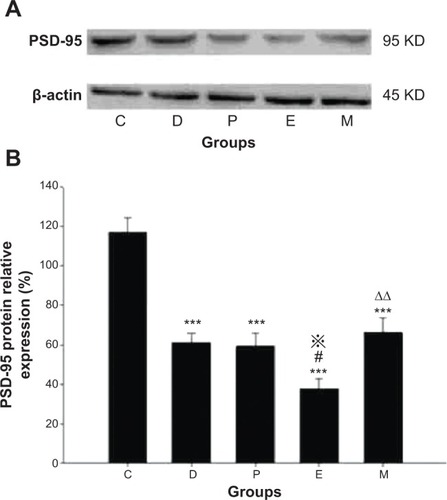
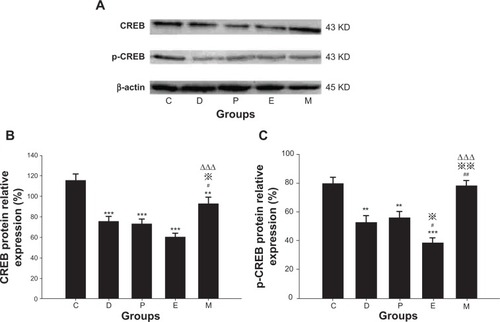
Figure 7 Hippocampal CREB/p-CREB protein expression in rats after ECS (or MECS) treatment.
Notes: Western blot bands of CREB/p-CREB and β-actin (A); relative expression of CREB protein (B); relative expression of p-CREB protein (C). Data are presented as the mean ± SE; **P<0.01, ***P<0.001 versus group C; #P<0.05, ##P<0.01 versus group D; P<0.05, P<0.01 versus group P; ΔΔΔP<0.001 versus group E. C represents control rats; D represents CUMS-pretreated rats that received sham ECS with normal saline pretreatment; P represents CUMS-pretreated rats that received sham ECS with propofol pretreatment; E represents CUMS-pretreated rats that received ECS with normal saline pretreatment; M represents CUMS-pretreated rats that received ECS with propofol pretreatment; n=5–6 in each group.
Abbreviations: CUMS, chronic unpredictable mild stresses; ECS, electroconvulsive shock; MECS, modified ECS; SE, standard error.
Abbreviations: CUMS, chronic unpredictable mild stresses; ECS, electroconvulsive shock; MECS, modified ECS; SE, standard error.