
Figures & data
Table 1 Demographic characteristics of the participants
Figure 1 Changes in the Athens Insomnia ScaleCitation13 score (A) and prevalence of insomnia (B) among insomniacs and non-insomniacs after arrival at high altitude.
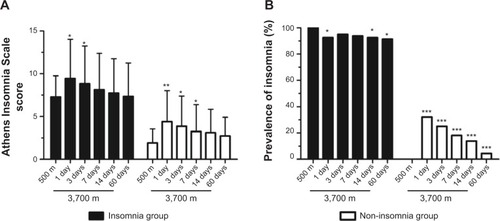
Figure 2 Changes in the prevalence of insomnia symptoms (Athens Insomnia ScaleCitation13 items) among insomniacs and non-insomniacs after arrival at high altitude.
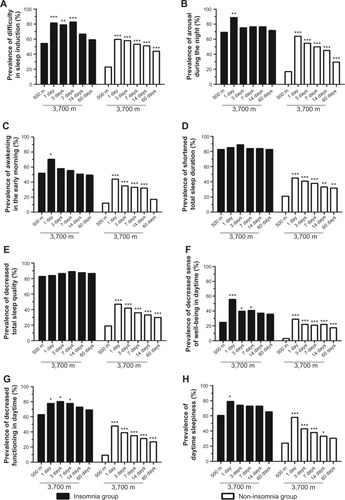
Figure 3 Comparisons of Lake Louise scoreCitation4 (A) and the prevalence of AMS (B) between the insomnia and non-insomnia groups at 3,700 m.
Abbreviation: AMS, acute mountain sickness.
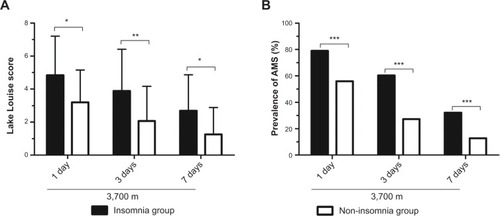
Figure 4 Comparisons of the prevalence of acute mountain sickness symptoms.
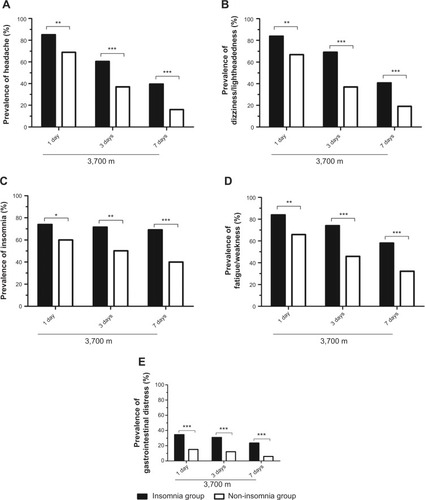
Table 2 Physiological parameters between the insomnia and non-insomnia groups
Table 3 Multivariate logistic regression analysis of the risk factors for acute mountain sickness