Figures & data
Table 1 Self-report versus clinical interview: advantages and disadvantages
Table 2 Alexithymia estimate standard score for each family member, family mean standard score, alexithymia standard score of the contrasts between family members related to the TSIA and the TAS-20 common factors, and total score
Figure 1 Family alexithymia mean standard score percentage: a comparison between the TSIA and the TAS-20.
Abbreviations: TSIA, Toronto Structured Interview for Alexithymia; TAS-20, Toronto Alexithymia Scale; F1, difficulty identifying feelings; F2, difficulty describing feelings; F3, externally oriented thinking; TOT, total score.
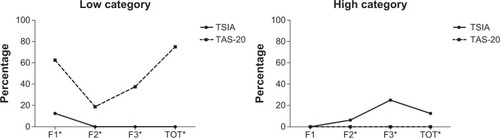
Figure 2 Family members alexithymia standard score percentage: a comparison between the TSIA and the TAS-20 for (A) daughter, (B) mother, and (C) father.
Abbreviations: TSIA, Toronto Structured Interview for Alexithymia; TAS-20, Toronto Alexithymia Scale; F1, difficulty identifying feelings; F2, difficulty describing feelings; F3, externally oriented thinking; TOT, total score.
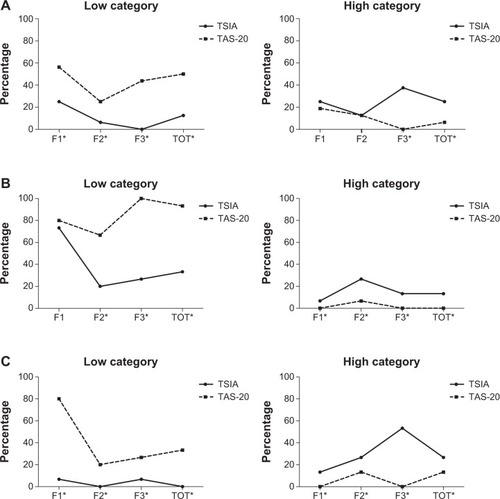
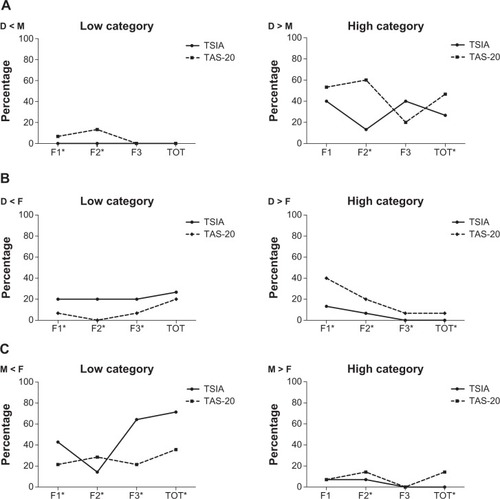
Figure 3 Family couple contrasts alexithymia standard score percentage: a comparison between the TSIA and the TAS-20 for (A) daughter (D) versus mother (M), (B) daughter (D) versus father (F), and (C) mother (M) versus father (F).
Abbreviations: TSIA, Toronto Structured Interview for Alexithymia; TAS-20, Toronto Alexithymia Scale; F1, difficulty identifying feelings; F2, difficulty describing feelings; F3, externally oriented thinking; TOT, total score.