
Figures & data
Table 1 Demographic and clinical characteristics of patients with OSA and GSs
Figure 1 Regional homogeneity modeled in the magnetic resonance images of the subjects in the transverse orientation, shown at four different levels through the brain (A). The modeled surface of the brain shown in different orientations. The red color signifies an increase in ReHo areas, and the blue signifies a decrease in ReHo areas (B).
Abbreviations: GSs, good sleepers; L, left; R, right; ReHo, regional homogeneity.
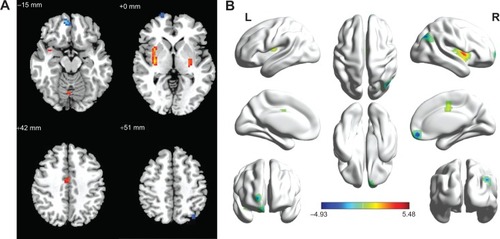
Figure 2 Mean ReHo signal values for altered regional brain areas. Patients with OSA showed altered ReHo in the right posterior lobe of the cerebellum (0.57±0.47 versus 0.17±0.38), left lentiform nucleus (0.93±0.49 versus -0.47±0.25), right lentiform nucleus (0.07±0.35 versus −0.44±0.25), right cingulate gyrus (0.78±0.52 versus 0.20±0.32), right medial frontal gyrus (−0.36±0.43 versus 0.31±0.45), right superior frontal gyrus (−0.08±0.45 versus 0.58±0.51), right precuneus (0.73±0.44 versus 1.33±0.40), and left superior parietal lobule (0.60±0.60 versus 1.25±0.35) compared with GSs.
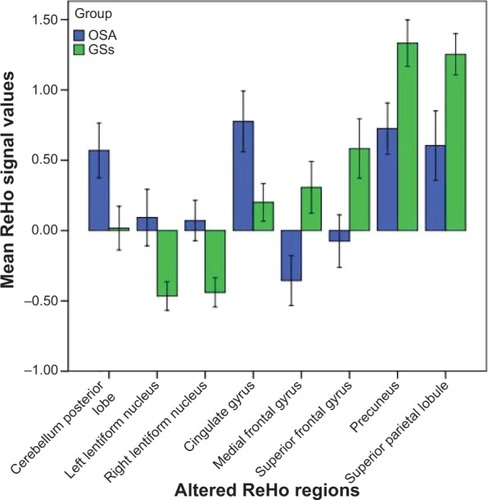
Table 2 Two-samples t-test differences in ReHo method between OSA and GSs