
Figures & data
Table 1 Inclusion and exclusion criteria in the minocycline study
Figure 1 Flow chart of patients recruited from Pakistan and entering the TD analysis.
Abbreviations: FEP, first episode psychosis; AIMS, Abnormal Involuntary Movement Scale; FGA, first-generation antipsychotic; SGA, second-generation antipsychotic; TD, tardive dyskinesia.
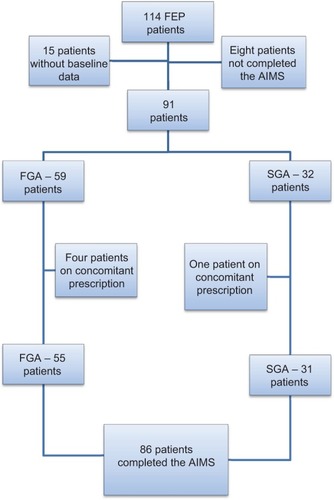
Table 2 Demographics of 86 patients included in the study
Table 3 Summary of scores for AIMS items 1–7 for patients treated with FGA or SGA