Figures & data
Table 1 Sociodemographic data, BDI, and STAI scores for the three BDNF genotype groups
Table 2 POMS scores for the three BDNF genotype groups
Table 3 NEO-PI-R and TCI scores for the three BDNF genotype groups
Table 4 Effects of BDNF genotype on heart rate variability
Figure 1 In the Trier Social Stress Test, there were no differences in female salivary α-amylase responses among the Val/Val, Val/Met, and Met/Met groups (F(2, 263)=0.37; P=0.69) (A). Similarly, there were no differences in male salivary α-amylase responses in the Trier Social Stress Test among the Val/Val, Val/Met, and Met/Met groups (F(2, 410)=0.10; P=0.91) (B).

Figure 2 In the Trier Social Stress Test, female Met/Met individuals have a stronger salivary cortisol response than Val/Met and Val/Val individuals (F(2, 263)=2.39; P=0.09) (A). Male Met/Met individuals showed stronger salivary cortisol responses than Val/Met and Val/Val individuals in the Trier Social Stress Test (F(2, 413)=3.19; P=0.04) (B). **P<0.01.
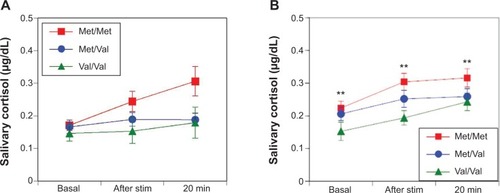
Figure 3 In the electrical stimulation stress test, there were no differences in female salivary α-amylase responses among the Val/Val, Val/Met, and Met/Met groups (F(2, 494)=1.62; P=0.20) (A). Similarly, there were no differences in male salivary α-amylase responses among the Val/Val, Val/Met, and Met/Met groups (F(2, 701)=0.13; P=0.88) (B).
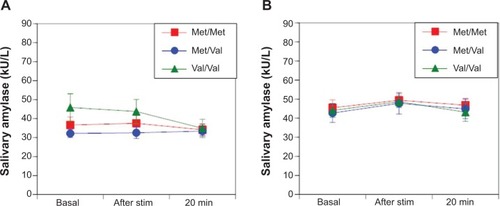
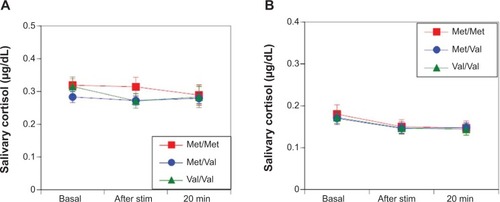
Figure 4 After the electrical stimulation stress test, there were no differences in female salivary cortisol responses among the Val/Val, Val/Met, and Met/Met groups (F(2, 377)=0.61; P=0.54) (A). Similarly, there were no differences in male salivary cortisol responses among the Val/Val, Val/Met, and Met/Met groups (F(2, 584)=0.03; P=0.97) (B).