
Figures & data
Table 1 Subject demographics and disposition – safety population
Table 2 Final ERC daily dose and overall total exposure
Table 3 Results of efficacy measurements
Figure 1 YMRS total score average by duration of treatment: ITT population.
Abbreviations: ITT, intent to treat; YMRS, Young Mania Rating Scale.
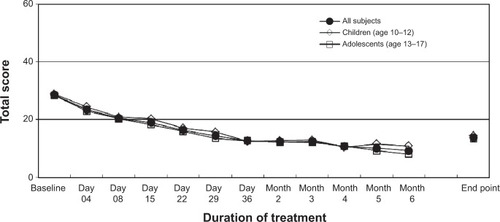
Table 4 Overall summary of adverse events – safety population