
Figures & data
Figure 1 The participants in the study.
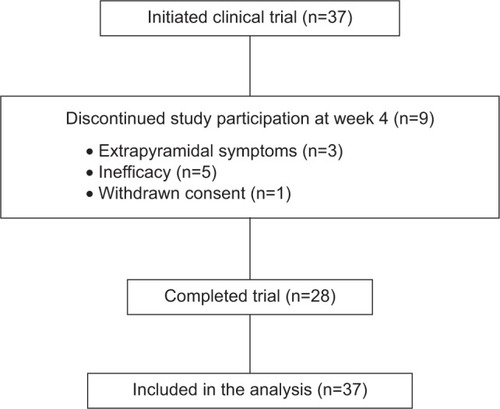
Table 1 Participants’ demographics
Figure 2 The response rate.
Abbreviation: PANSS, Positive and Negative Syndrome Scale.
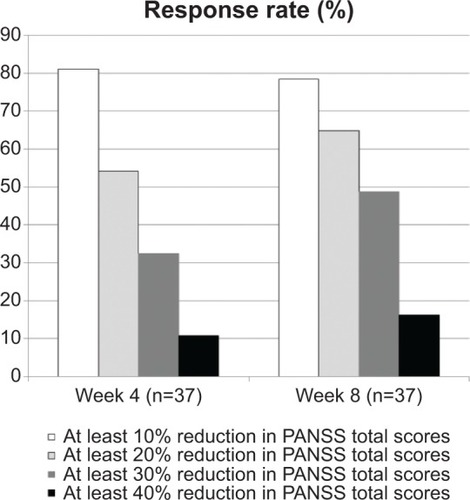
Table 2 Changes from baseline to week 4 and to week 8 in the PANSS total scores and PANSS subscores
Table 3 Conditional probabilities that the response at week 4 will predict the response at week 8 using thresholds for an early response of ≥10%, ≥20%, and ≥30% improvement in the PANSS total scores and thresholds for later responses of ≥20%, ≥30%, and ≥40% improvement in the PANSS total score