Figures & data
Figure 1 Subject recruitment procedure in current study.
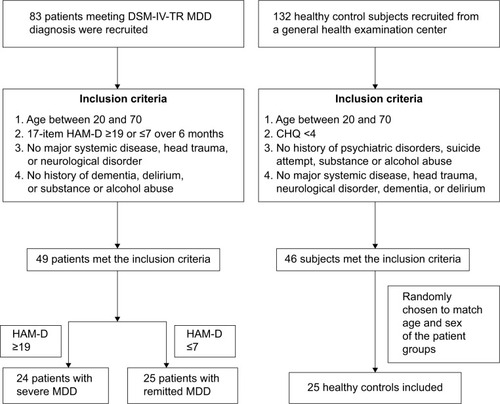
Table 1 Demographic and clinical characteristics of subjects included in current study
Figure 2 (A) 5-methylcytosine (5-mc) and (B) 5-hydroxymethylcytosine (5-hmc) levels in patients with severe major depressive disorder (MDD), remitted MDD, and healthy controls, divided by sex (n=30 in males and n=44 in females).
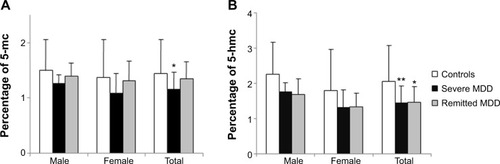
Figure 3 (A) 5-methylcytosine (5-mc) and (B) 5-hydroxymethylcytosine (5-hmc) levels in patients with severe major depressive disorder (MDD), remitted MDD, and healthy controls, in different age groups (n=14 for younger group, n=29 for middle-age group, and n=31 for older age group).
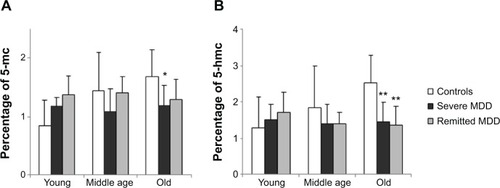
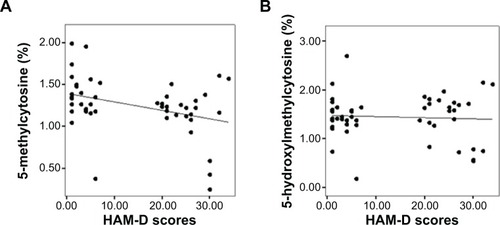
Figure 4 Scatterplots of the correlation between (A) 5-methylcytosine (5-mc) levels, and (B) 5-hydroxymethylcytosine (5-hmc) levels and the severity of depressive symptoms shown as HAM-D.
Abbreviation: HAM-D, Hamilton Depression Rating Scale.