
Figures & data
Figure 1 The dot plot figure of BDNF in patients with vitiligo and healthy controls.
Abbreviation: BDNF, brain-derived neurotrophic factor.
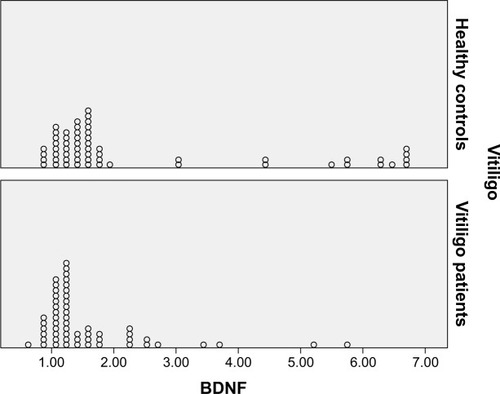
Table 1 Comparison of age, sex, BAI, BDI, and serum BDNF level in subjects with vitiligo and healthy control groups
Table 2 Correlation coefficients BDNF, age, BAI, BDI, DLQI, and the value of “rule of nine” in vitiligo and healthy control groups