Figures & data
Notes: Of the patients who met inclusion criteria for the iSPOT-D study, additional criteria were used for this specific analysis. *Minimum criteria for assessment at week 8 is either completion of the HRSD17 or SOFAS assessments at the in-person visit, or completion of the week 8 QIDS-SR16 in the online questionnaire at home.
Abbreviations: QIDS-SR16, 16-item Quick Inventory of Depressive Symptomatology Self-Report; iSPOT-D, International Study to Predict Treatment Response in Depression; XR, extended release; HRSD17, 17-item Hamilton Rating Scale for Depression.
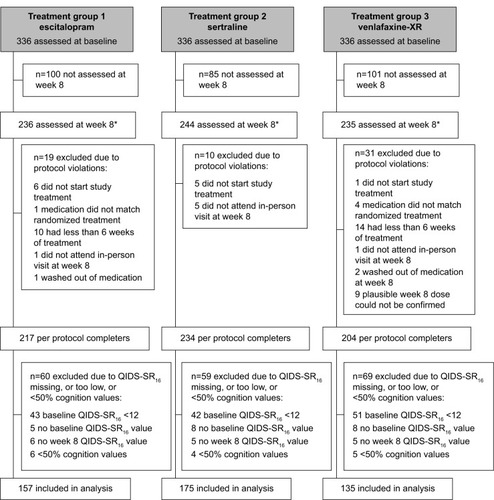
Notes: Each treatment arm was stratified into two groups. Remission could be predicted 10 percentage points above chance. The specific subgroup and threshold is reported. The specific regression equation for each treatment arm is reported. Additionally, the number of patients in each treatment arm and each subgroup is also reported. DT result is the Depression Treatment Test predictive outcome. *Defined as average of z-scores for emotion identification number of correct responses and reaction time for correct responses. **Defined as average of z-scores for maze completion time, maze total number of errors and number of overrun errors, switching of attention completion time, verbal interference reaction time incongruent trials, continuous performance test reaction time, digit span total number of trials correct, and emotion identification number of correct response and reaction time for correct responses.
Abbreviations: DT, depression treatment test; QIDS-SR16, 16-item Quick Inventory of Depressive Symptomatology Self-Report; XR, extended release.
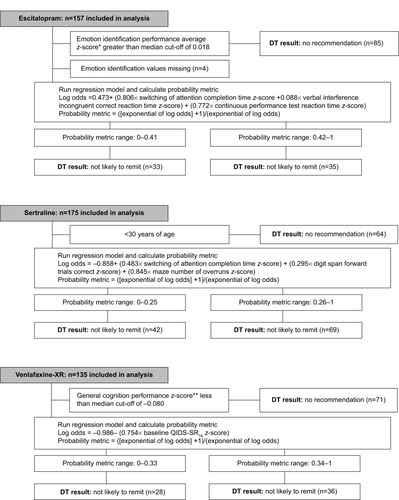
Notes: This figure illustrates that regression models using cognition and emotion predictors outperform those that use only age and sex (A) or depression severity (B) (baseline QIDS-SR16). The ROC curves were generated using the probability of remission obtained from each regression equation. Only the patients who met criteria for the logistic regression model were used to generate the ROC curves and calculate the AUC.
Abbreviations: AUC, area under the curve; QIDS-SR16, 16-item Quick Inventory of Depressive Symptomatology Self-Report; ROC, receiver operating characteristics; XR, extended release.
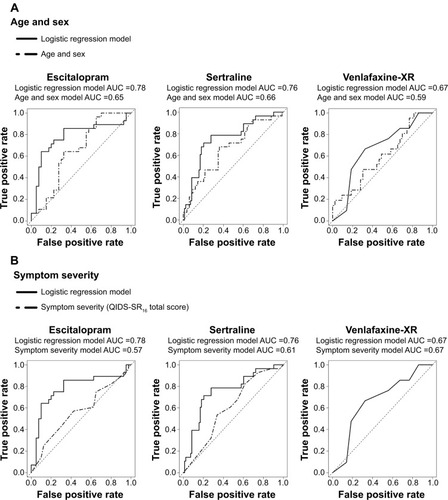
Notes: Relative risks were calculated using the remission rate for the specific patients for whom a prediction was made. A horizontal bar is drawn at a relative risk of 1 to allow for chance comparisons. Patients predicted to not remit, with a relative risk of 0.5–0.6, have one half the remission rate for the subgroup used to develop the specific regression model. Patients predicted to remit, with a relative risk of 1.5–1.9, have one and a half to two times the remission rate for the subgroup used to develop the specific regression model.
Abbreviation: XR, extended release.
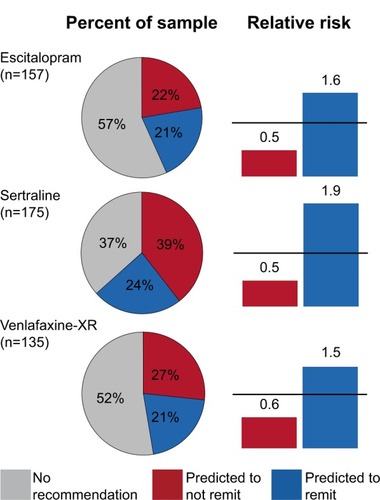