58
Views
1
CrossRef citations to date
0
Altmetric
Original Research

Cattle encephalon glycoside and ignotin injection improves cognitive impairment in APPswe/PS1dE9 mice used as multitarget anti-Alzheimer’s drug candidates

, , , , , , , , & show all
Pages 537-548 | Published online: 27 Feb 2015

Figures & data

Figure 1 Effects of CEGI on spatial learning and memory evaluated by the Morris water-maze test for 5 consecutive days of training in APP/PS1 mice.

Notes: #P<0.05, ##P<0.01 compared with the transgenic (Tg) group. (A) Escape latency to reach the hidden platform in the Morris water maze; (B) swimming time within the target quadrant; (C) swimming speed during the consecutive days of training. Data presented as means ± SE, n=11–12 mice in each group.
Abbreviations: CEGI, cattle encephalon glycoside and ignotin injection; SE, standard error; H, high dose; L, low dose; APP, β-amyloid precursor protein; PS, presenilin.
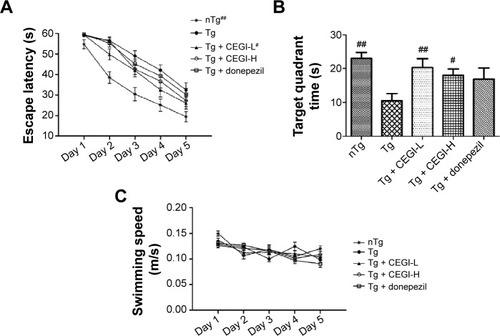
Figure 1 Effects of CEGI on spatial learning and memory evaluated by the Morris water-maze test for 5 consecutive days of training in APP/PS1 mice.

Figure 2 Effects of CEGI on the levels of total Aβ42 in whole-brain lysates of APP/PS1 mice.

Notes: **P<0.01 compared with the nontransgenic (nTg) group; #P<0.05, ##P<0.01 compared with the transgenic (Tg) group. Data presented as means ± SE, n=7–8 mice in each group.
Abbreviations: CEGI, cattle encephalon glycoside and ignotin injection; Aβ, amyloid-β; SE, standard error; H, high dose; L, low dose; APP, β-amyloid precursor protein; PS, presenilin.
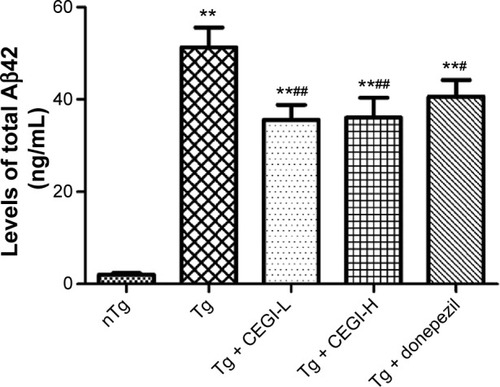
Figure 2 Effects of CEGI on the levels of total Aβ42 in whole-brain lysates of APP/PS1 mice.

Figure 3 Effects of CEGI on biomarkers of oxidative stress and cholinergic metabolism in APP/PS1 mice.

Notes: *P<0.05, **P<0.01 compared with the nontransgenic (nTg) group; #P<0.05 compared with the transgenic (Tg) group. (A) SOD activity; (B) MDA level; (C) AChE activity; (D) ChAT activity. Data presented as means ± SE, n=7–8 mice in each group.
Abbreviations: CEGI, cattle encephalon glycoside and ignotin injection; SOD, superoxide dismutase; MDA, malondialdehyde; AChE, acetylcholinesterase choline; ChAT, choline acetyltransferase; SE, standard error; H, high dose; L, low dose; prot, protein; APP, β-amyloid precursor protein; PS, presenilin.
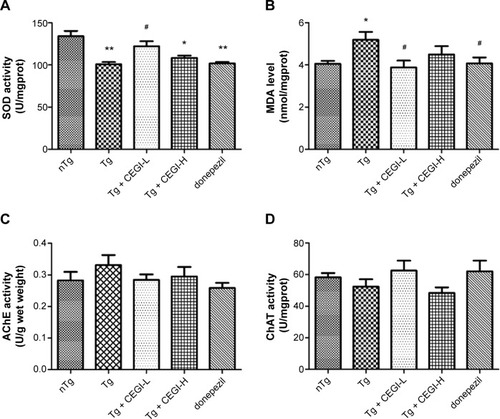
Figure 3 Effects of CEGI on biomarkers of oxidative stress and cholinergic metabolism in APP/PS1 mice.

Figure 4 Effects of CEGI on the neuronal morphology and expression of Bcl-2 family members in the CA1 region of the hippocampus in APP/PS1 mice.

Notes: *P<0.05, **P<0.01 compared with the nontransgenic (nTg) group; #P<0.05, ##P<0.01 compared with the transgenic (Tg) group. (AE) Hematoxylin and eosin staining. The neurons in the brains of nTg mice were found to be intact and well arranged. On the other hand, the neurons in the Tg mice exhibited shrunken and triangulated neuronal bodies (black arrows). The cells were disordered, with a slightly changed cell polarity. Treatment with CEGI or donepezil diminished the shrunken and triangulated neurons (black arrows) in the hippocampal CA1, and the neurons recovered their characteristic shape and arrangement, similar to the nTg mice; however, an enlarged extracellular gap was detected. (FJ) Immunohistochemical staining for Bcl-2. (KO) Immunohistochemical staining for Bax. Scale bar 50 μm. (P) Statistical graph displaying the mean optical density of Bcl-2; (Q) statistical graph displaying the mean optical density of Bax; (R) a statistical graph displaying the ratio of Bcl-2/Bax. Data presented as means ± SE, n=7–8 mice in each group.
Abbreviations: CEGI, cattle encephalon glycoside and ignotin injection; SE, standard error; H, high dose; L, low dose; APP, β-amyloid precursor protein; PS, presenilin.
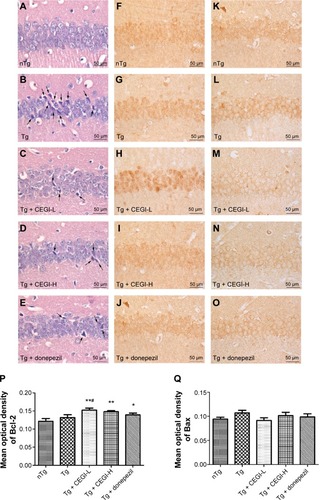
Figure 4 Effects of CEGI on the neuronal morphology and expression of Bcl-2 family members in the CA1 region of the hippocampus in APP/PS1 mice.

Figure 5 Effects of CEGI on mRNA expression of Bcl-2 family members in the hippocampus of APP/PS1 mice.

Notes: *P<0.05, **P<0.01 compared with the nontransgenic (nTg) group; #P<0.05, ##P<0.01 compared with the transgenic (Tg) group. (A) Representative images of mRNA expression for Bcl-2 and Bax. As the internal control, cyclophilin mRNA was also reverse-transcribed and amplified. (B) Statistical graph displaying Bcl-2; (C) statistical graph displaying Bax; (D) a statistical graph displaying the ratio of Bcl-2/Bax mRNA expression. Results expressed as means ± SE (n=3).
Abbreviations: CEGI, cattle encephalon glycoside and ignotin injection; mRNA, messenger ribonucleic acid; SE, standard error; H, high dose; L, low dose; APP, β-amyloid precursor protein; PS, presenilin.
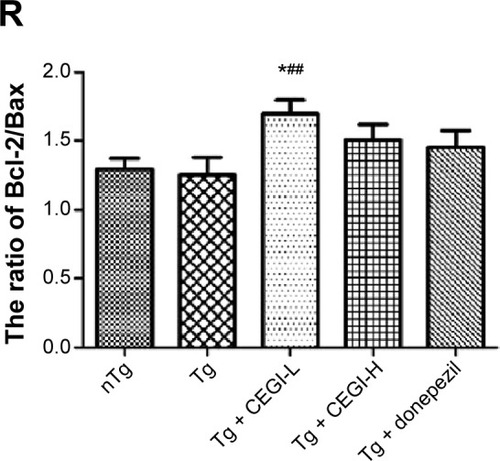
Figure 5 Effects of CEGI on mRNA expression of Bcl-2 family members in the hippocampus of APP/PS1 mice.

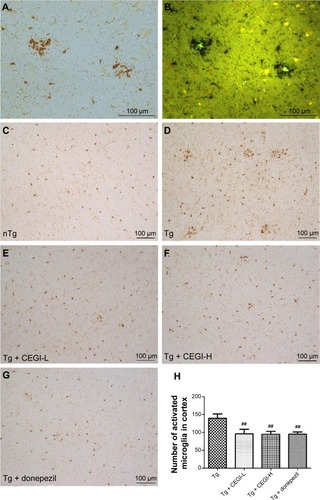
Figure 6 Effects of CEGI on the expression of activated microglia in the cortex of APP/PS1 mice.

Notes: ##P<0.05 compared with the transgenic (Tg) group. (A) Immunohistochemistry staining for activated microglia; (B) thioflavin S fluorescence staining for Aβ plaques. Expression of Iba1+ activated microglia in (C) nontransgenic (nTg) group; (D) Tg group; (E) Tg + CEGI-L group; (F) Tg + CEGI-H group; (G) Tg + donepezil group. Scale bar 100 μm. (H) the number of activated microglia in the cortex of the Tg group and the drug group. Data presented as means ± SE, n=6–7 mice in each group.
Abbreviations: CEGI, cattle encephalon glycoside and ignotin injection; SE, standard error; H, high dose; L, low dose; APP, β-amyloid precursor protein; PS, presenilin.
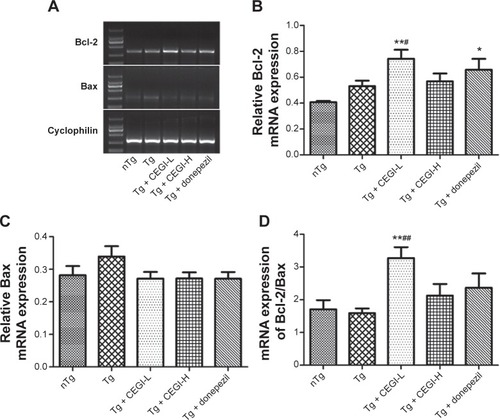
Figure 6 Effects of CEGI on the expression of activated microglia in the cortex of APP/PS1 mice.