Figures & data
Table 1 Demographic features by group
Figure 1 Mean values of LTA for each frequency band distinctly for the SUD group and CG as a function of condition (AD versus DD).
Notes: (A) Delta; (B) theta; (C) alpha; and (D) beta.
Abbreviations: AD, advantageous decks; DD, disadvantageous decks; SUD, substance use disorder; CG, control group; LTA, log-transformed asymmetry.
Abbreviations: AD, advantageous decks; DD, disadvantageous decks; SUD, substance use disorder; CG, control group; LTA, log-transformed asymmetry.
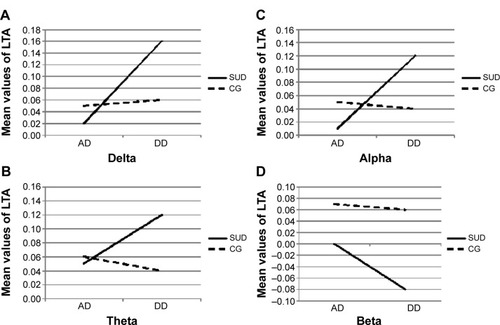
Table 2 Mean and SD values of rI as a function of group (SUD versus CG) and block
Table 3 Mean and SD values of LTA as a function of group (SUD versus CG) and condition (AD versus DD) for each frequency band
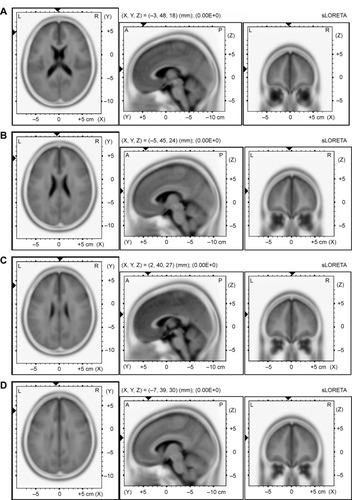
Figure 2 Results of the sLORETA analysis.
Notes: The image shows the sLORETA slices in the Talairach space for the estimated source of activation differences between CG and SUD for DD, respectively, for (A) delta, (B) theta, (C) alpha, and (D) beta.
Abbreviations: sLORETA, standardized low-resolution brain electromagnetic tomography; CG, control group; SUD, substance use disorder; DD, disadvantageous decks.
Abbreviations: sLORETA, standardized low-resolution brain electromagnetic tomography; CG, control group; SUD, substance use disorder; DD, disadvantageous decks.