
Figures & data
Figure 1 Patients’ disposition.
Abbreviation: ITT, intent-to-treat.
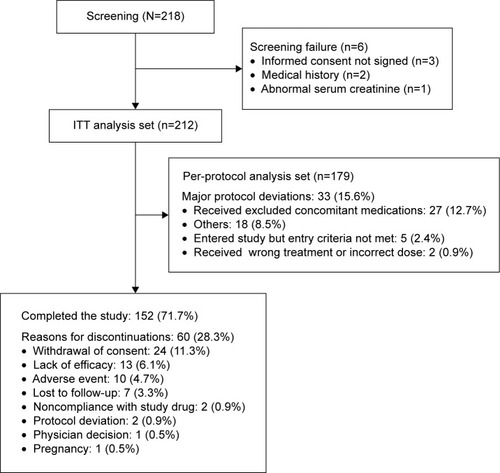
Table 1 Demographic and baseline characteristics (ITT analysis set)
Figure 2 Mean (±2 SE) change in PANSS total score from baseline at each timepoint, and at week 13 (ITT analysis set).
Note: *P<0.001 for change from baseline using paired t-test.
Abbreviations: ITT, intent-to-treat; LOCF, last observation carried forward; PANSS, Positive and Negative Syndrome Scale; SE, standard error.
Abbreviations: ITT, intent-to-treat; LOCF, last observation carried forward; PANSS, Positive and Negative Syndrome Scale; SE, standard error.
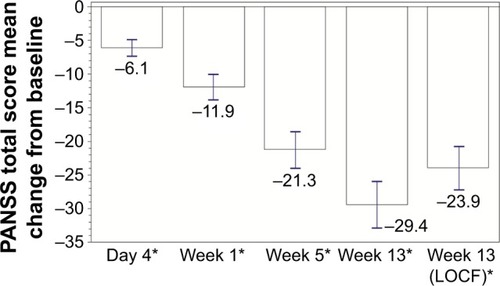
Figure 3 PANSS responder rates at each timepoint and at week 13 (ITT analysis set).
Abbreviations: ITT, intent-to-treat; LOCF, last observation carried forward; PANSS, Positive and Negative Syndrome Scale.
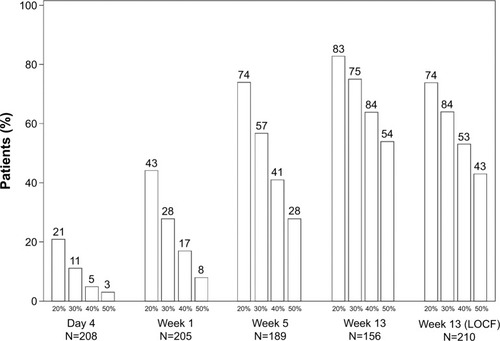
Table 2 Change from baseline to each timepoint, and at week 13 in the secondary endpoints (ITT analysis set; LOCF)
Table 3 Most common (≥2% patients) TEAEs (ITT analysis set)