Figures & data
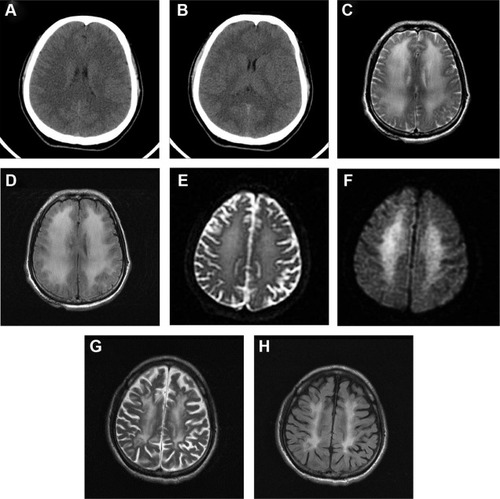
Figure 1 Images of delayed postanoxic encephalopathy.
Notes: (A and B) Brain CT at day 1; image A shows a higher axial cut level than image B which shows an axial cut at the basal ganglion level; (C) T2WI of brain MRI at day 30; (D) FLAIR of brain MRI at day 30; (E) T2WI of brain MRI at day 95; (F) FLAIR of brain MRI at day 95; (G) T2WI of brain MRI 6 years after the hypoxic event; (H) FLAIR of brain MRI 6 years after the hypoxic event.
Abbreviations: CT, computed tomography; T2WI, T2-weighted imaging; MRI, magnetic resonance imaging; FLAIR, fluid-attenuated inversion recovery.
Abbreviations: CT, computed tomography; T2WI, T2-weighted imaging; MRI, magnetic resonance imaging; FLAIR, fluid-attenuated inversion recovery.