Figures & data
Figure 1 Magnetic resonance imaging of the patient’s brain.
Notes: (A) A T2-weighted image showing hyperintensity lesions (arrows) in the temporal lobes and left occipital lobe. (B) Multiple hyperintensities (arrows) in the temporal and parietal lobes and demyelination in the white matter surrounding the lateral ventricles revealed by the fluid-attenuated inversion recovery sequences. (C) A susceptibility-weighted image showing a low signal (arrow) in the right frontal lobe.
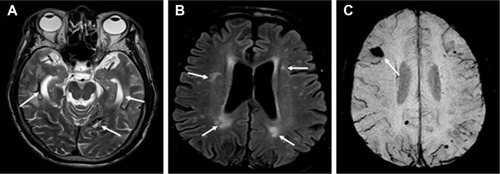
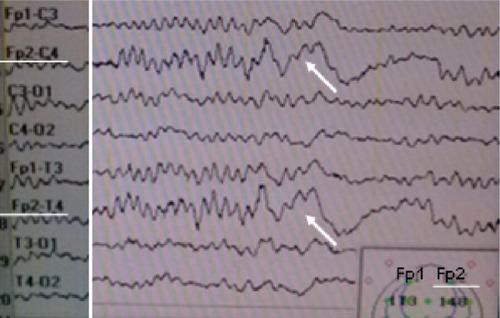
Figure 2 The electroencephalogram of the patient showing slow-waves characterized by strong peaks of delta (δ) and theta (θ) frequencies in the right frontal lobe.
Note: The arrows point to slow-waves from the Fp2-C4 and Fp2-L4.