
Figures & data
Figure 1 Patient disposition.
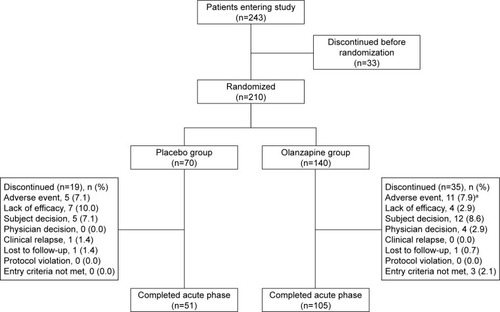
Table 1 Baseline demographics and illness characteristics of Chinese study participants with bipolar depression treated with olanzapine or placebo
Figure 2 Visit-wise change from baseline in LS mean MADRS total score ±95% CI for entire Chinese subpopulation.
Abbreviations: CI, confidence interval; LS, least-squares; MADRS, Montgomery-Åsberg Depression Rating Scale.
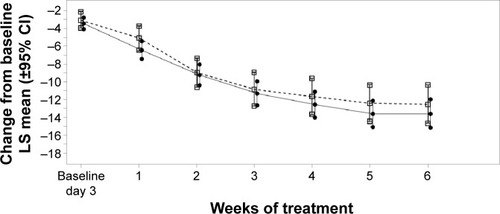
Table 2 Baseline to endpoint least-squares mean changes in CGI-BP, HAMD-17, and YMRS
Table 3 Response, symptomatic remission, and recovery rates
Figure 3 Visit-wise change of MADRS total score from baseline (LOCF) for individual subjects with emergence of mania in placebo and olanzapine group.
Abbreviations: LS, least-squares; MADRS, Montgomery-Åsberg Depression Rating Scale; LOCF, last-observation-carried-forward.
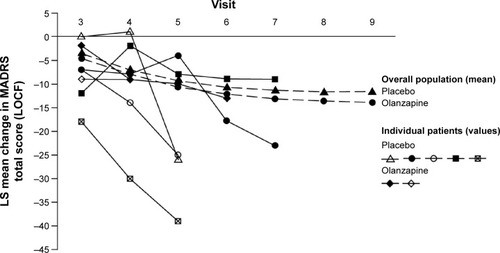
Table 4 Treatment difference between olanzapine and placebo groups in least-squares mean change in MADRS total score (95% confidence interval) using the MADRS score of the visit before mania emergence and excluding patients with emergence of mania
Table 5 Common TEAEs occurring in ≥2% of patients with any treatment
Table 6 Mean change from baseline to endpoint values in laboratory analytes (except glucose and lipid panel)