
Figures & data
Table 1 Sample Sociodemographic Characteristics (n = 334)
Table 2 Mean Scores of CS, BO, STS According to the Sample Sociodemographic Characteristics (n = 334)
Figure 1 Sample distribution according to subscale levels (%) (n-334).
Abbreviations: CS, compassion satisfaction; CF, compassion fatigue; BO, burnout; STS, secondary traumatic stress.
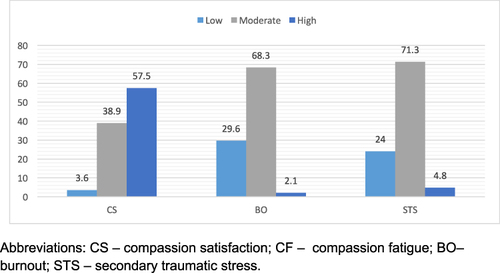
Table 3 CS, BO, and STS Among the Sample of Saudi Nurses (n = 334)