
Figures & data
Figure 1 Conceptual framework on Educational Program Regarding Neurological Examination on Nurses.
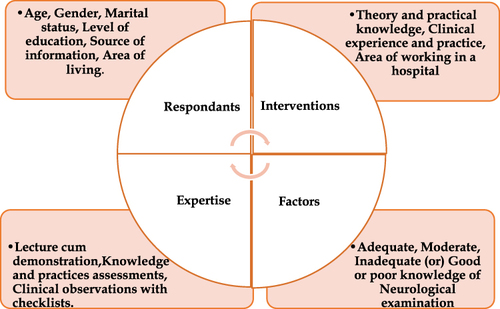
Figure 2 Schematic presentation of Research design on Educational Program Regarding Neurological Examination on Nurses.
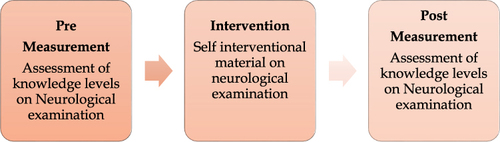
Figure 3 Scoring key of knowledge levels on neurological examination.
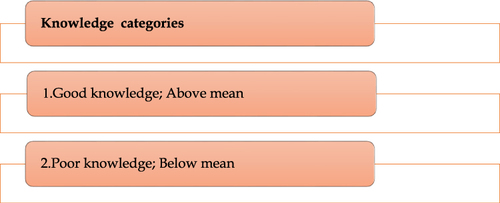
Table 1 Description of Demographic Characteristics of Staff Nurses on Educational Programme Regarding Neurological Examination (n=56)
Figure 4 Percentage distributions on demographic variables of staff nurses (A) – age (B) gender (C) – religion (D) - level of education (E) -marital status (F) - family income per month in ETB (G) - type of family (H) - area of clinical experience (I) - duration of clinical experience (J) - source of Information.
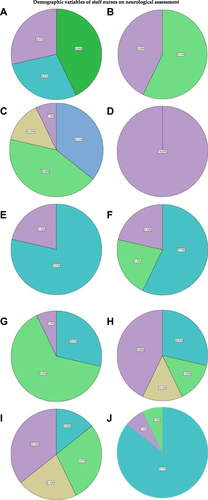
Table 2 Pre and Post Measurement of Knowledge Levels of Staff Nurses on Neurological Examination with Paired t-Value (n=56)
Figure 5 Percentages on before and after measurement knowledge levels on neurological examination among staff nurses.
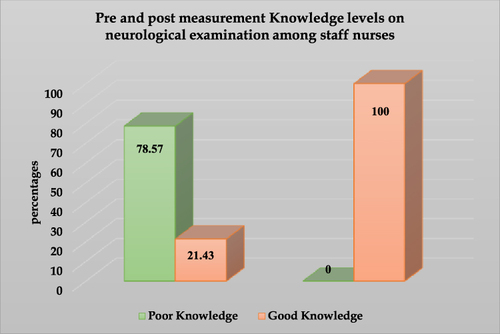
Table 3 Association Between Knowledge and Demographics