
Figures & data
Table 1 Physical properties of the binders
Table 2 Interfacial tensions calculated using Antonoff and Girifalco and Good methods for binders and dispersed NPs
Table 3 Spreading coefficients for neat and diluted binders with dispersed NPs in IPA
Table 4 Spreading coefficient for neat binders and solid NPs
Figure 1 SEM of surface morphology with increasing ECA wt% on two different substrates.
Abbreviations: ECA, ethyl cyanoacrylate; PC, polycarbonate; SEM, scanning electron microscopy; SH, superhydrophobic.
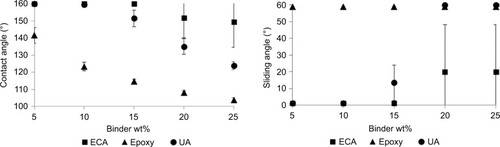
Figure 2 Scanning electron microscopy of surface morphology with increasing epoxy wt% on two different substrates.
Abbreviations: PC, polycarbonate; SH, superhydrophobic.
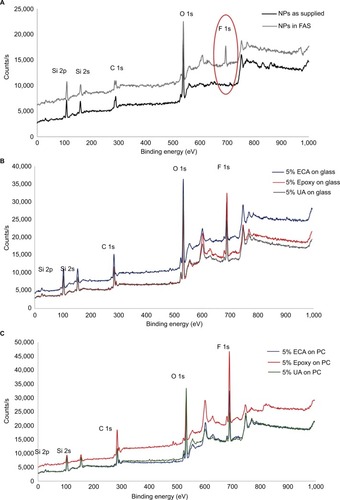
Figure 3 SEM of surface morphology with increasing UA wt% on two different substrates.
Abbreviations: PC, polycarbonate; SEM, scanning electron microscopy; UA, urethane acrylate; SH, superhydrophobic.
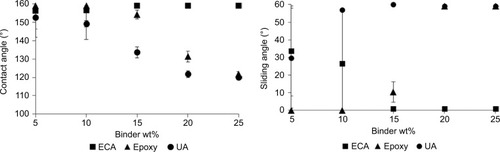
Table 5 Surface free energy calculation for PC based on Zisman and LW/AB methods
Table 6 Interfacial tension for acetone solvent and uncured binders with glass
Table 7 Interfacial tension for acetone solvent and uncured binders with PC
Figure 4 Wetting characteristics on glass using contact angle and sliding angle measurements for three different binder formulations as a function of increasing wt% binder.
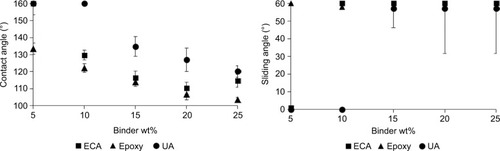
Figure 5 Wetting characteristics on PC using contact angle and sliding angle measurements for three different binder formulations as a function of increasing wt% binder.
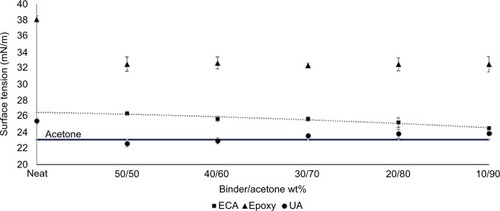
Figure 6 XPS of silica, binders on glass and PC.
Notes: (A) XPS survey scanning of the surface composition of dry, as-supplied silica NPs and with the presence of FAS; (B) XPS survey scanning of all 5 wt% binder formulations on glass; and (C) XPS survey scanning of all 5 wt% binder formulations on PC. The red circle indicates position of fluorine peak.
Abbreviations: ECA, ethyl cyanoacrylate; NPs, nanoparticles; PC, polycarbonate; UA, urethane acrylate; XPS, X-ray photoelectron spectroscopy; FAS, fluoroalkylsilane.
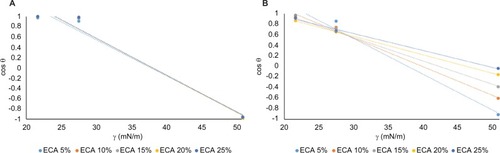
Table 8 SFE calculation for neat cured binders and PC based on Zisman and LW/AB methods
Table 9 SFE values for all binder formulations on glass and PC using Zisman’s method
Figure 7 Wetting characteristics after the tape test on glass using contact angle and sliding angle measurements for three different binder formulations with increasing binder wt%.
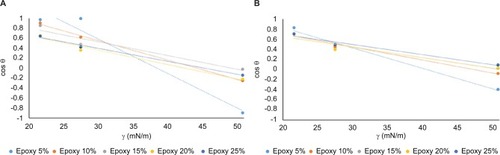
Figure 8 Wetting characteristics after the tape test on PC using contact angle and sliding angle measurements for three different binder formulations with increasing binder wt%.
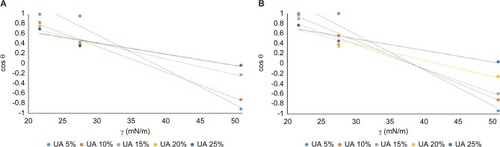
Figure S1 Surface tension results for neat and diluted uncured binders using pendant drop method.
Abbreviations: ECA, ethyl cyanoacrylate; UA, urethane acrylate.
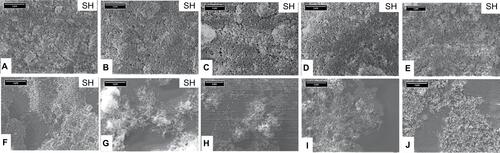
Figure S2 Zisman linear regression plot to find the critical surface free energy for ECA formulations (A) on glass (B) on PC.
Abbreviations: ECA, ethyl cyanoacrylate; PC, polycarbonate.
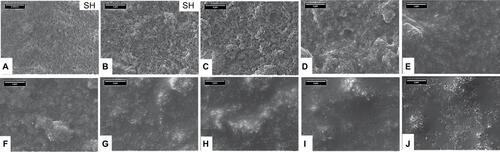
Figure S3 Zisman linear regression plot to find the critical surface free energy for epoxy formulations (A) on glass (B) on PC.
Abbreviation: PC, polycarbonate.
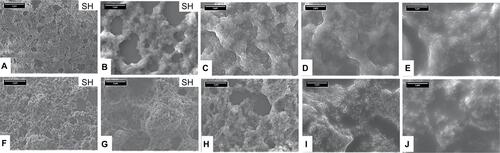
Figure S4 Zisman linear regression plot to find the critical surface free energy for UA formulations (A) on glass and (B) on PC.
Abbreviations: PC, polycarbonate; UA, urethane acrylate.
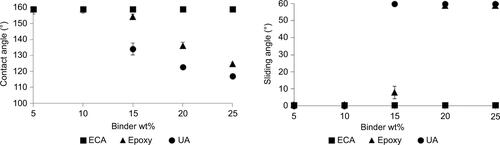
Table S1 Surface tension calculation for neat and diluted binders