Figures & data
Figure 1 Scheme of the EACA-loaded BSA NCs synthesis.
Abbreviations: EACA, ε-aminocaproic acid; BSA, bovine serum albumin; NCs, nanoclusters; MNPs, magnetite nanoparticles; PEG, polyethylene glycol; MCE, mixed cellulose ester.
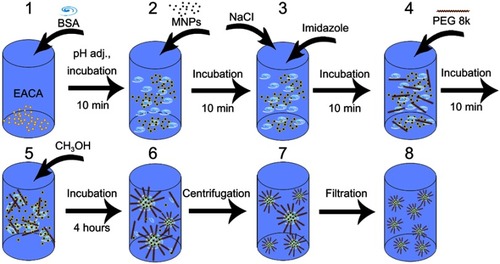
Figure 2 (A) Hydrodynamic diameter of EACA-loaded BSA NCs after filtration through 0.45 µm MCE membrane, the average diameter is 186±24 nm, no MNPs peak (typically around 20 nm) observed which prove the incorporation of MNPs inside BSA NCs. On inset (I): hydrodynamic radius after 2 days of storage, only MNPs and BSA nanoparticles peak is present, which indicates total destruction of NCs. On inset (II): SEM image of filtered BSA NCs. (B) SEM image of as-prepared EACA-loaded BSA NCs before filtration, a small amount of aggregated NCs observed. On inset: size distribution of freshly prepared unfiltered NCs (diameter in nm). (C) The HRTEM image of BSA NCs consisted of smaller structural building blocks. (D) The enlarged HRTEM image of BSA NC. On inset: the enlarged fragment of BSA NC with supposed PEG layer showed by red circles. (E) The enlarged HRTEM image of a BSA nanoparticle structural block. (F) The HRTEM image of MNPs (encircled) inside nanocontainer.
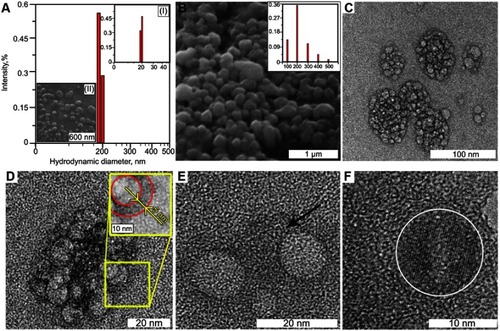
Figure 3 The release profile of rhodamine B from BSA NCs. About 5% of the initial load released within the first hour. Almost constant release rate remains for 24 hrs, and during the next 24 hrs, no additional rhodamine B was released. Mean values are presented with standard deviation.
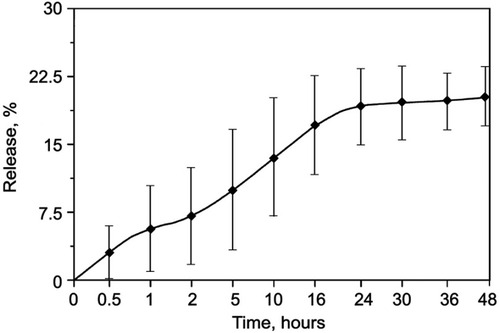
Figure 4 Metabolic activity according to the MTT assay of IMR-32 cells after incubation with different concentration of BSA NCs for 24 hrs. Mean values with standard deviation are represented. Control value was set as 100% of metabolic activity. No cytotoxicity was observed in the whole range of concentrations except the 16 mg BSA/mL. Also, no cytotoxicity was observed for BSA NCs supernatant in concentration 10% vt.
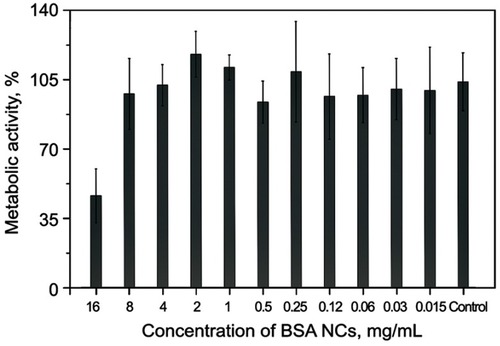
Figure 5 CloFAL curves of reference clot (yellow, no inhibitors were added), with the addition of 1 µL of EACA-loaded BSA NCs supernatant (green), with the addition of 1 µL of 1 mg/mL EACA (red), and with the addition of 1 µL of 50 mg/mL EACA (blue).
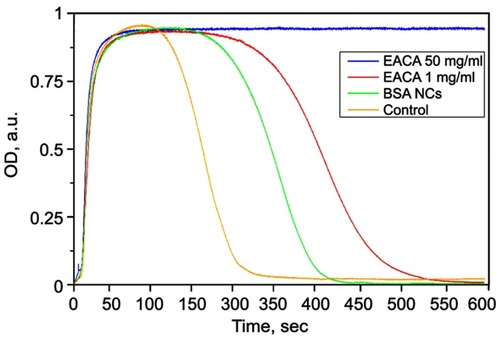
Table 1 CloFAL curve parameters for reference and test clot samples
Figure 6 (A-C) Accumulation of EACA-loaded BSA NCs on the clot under the magnetic field. (A) 0 min (start of the experiment), (B) after 3 min, (C) after 5 min. (D-H) In vitro comparison of the fibrinolysis process of non-treated fibrin clots and treated with NCs (clots encircled by a dashed line). (D) 0 min (start of the experiment), (E) 8 min, (F) 16 min, (G) 24 min, (H) 29 min. (I) Lysis kinetics of clots treated with buffer (control), BSA NCs without MNPs, and BSA NCs with MNPs. Mean values of n=3 experiments presented, vertical bars are standard deviation, dot lines are polynomial approximation (second order).
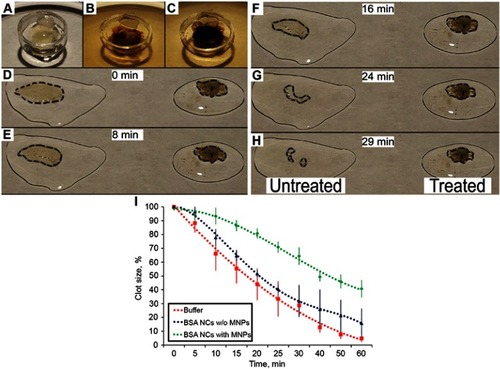
Figure 7 (A) Scheme of the flow setup. Syringe pump connected to two contour system made of silicone tubes. Center part of the first contour made from glass and placed on the microscope table. Fibrin clot placed inside this tube and hold in place by the filter. The enlarged fragment shows accumulation of NCs around the clot. (B-D) Images of accumulation of EACA-loaded BSA NCs around the fibrin clot in the flow system. Holding filter marked with red dash line, clot with a green dash line, NCs with a light blue dash line. The direction of flow marked with an arrow. The magnet position is shown schematically. (B) On the initial stage, the clot is pale yellow and clearly seen. (C) NCs start to accumulate after 5 min; the color of the clot become more brownish. (D) NCs accumulated mainly in front of the magnet and clot after 15 min, and clot became even more darker brownish.
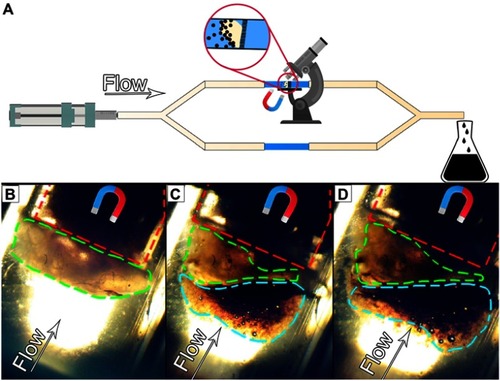
Figure S1 Curve of Clot Formation and Lysis (CloFAL) assay, demonstrating principal CloFAL parameters.
Abbreviation: CloFAL, clot formation and lysis.
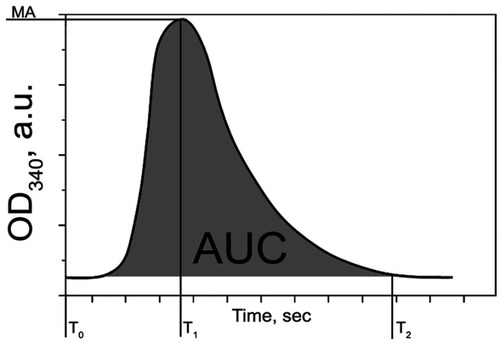
Figure S2 XRD spectra of pure MNPs (green line), BSA NCs with MNPs (black line), and BSA NCs without MNPs. Red lines show references to JCPDS file No. 19-0629 (XRD pattern for magnetite). Peaks attributed to NaCl traces were found in the sample of BSA NCs without MNPs.
Abbreviations: XRD, X-ray diffraction; BSA, bovine serum albumin; NCs, nanoclusters; MNPs, magnetite nanoparticles; JCPDS, The Joint Committee on Powder Diffraction Standards.
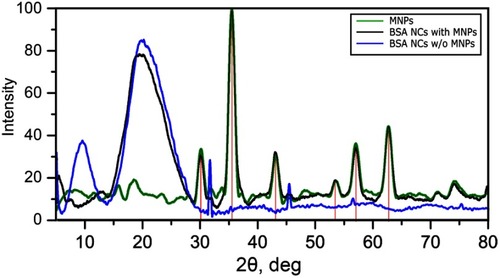
Figure S3 FTIR spectra of BSA NCs with MNPs (black), BSA NCs without MNPs (red), and pure MNPs (green).
Abbreviations: FTIR, fourier-transform infrared spectroscopy; BSA, bovine serum albumin; NCs, nanoclusters; MNPs, magnetite nanoparticles.
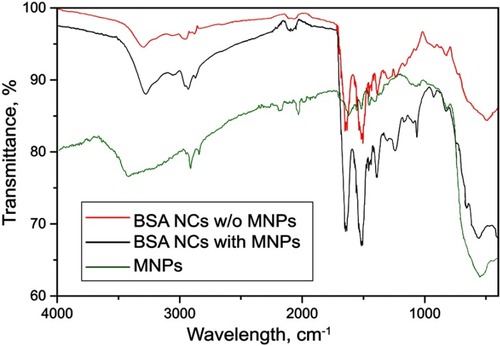
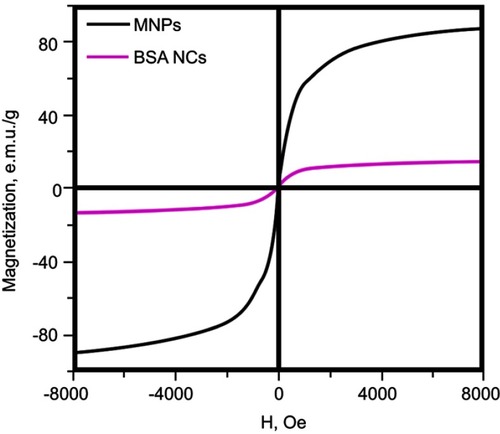
Figure S4 Magnetization curves of MNPs and BSA NCs.
Abbreviations: MNPs, magnetite nanoparticles; BSA, bovine serum albumin; NCs, nanoclusters; MNPs, magnetite nanoparticles.