
Figures & data
Table 1 The Compositions of the Prepared Polymer Nanocomposites
Figure 1 Contact angle measurement: (A) the measuring system, (B) the image of the drop on the surface of polymer nanocomposite.
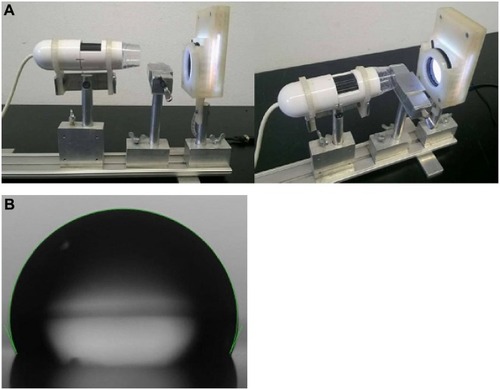
Figure 2 The optical microscopy images of the studied microorganisms.
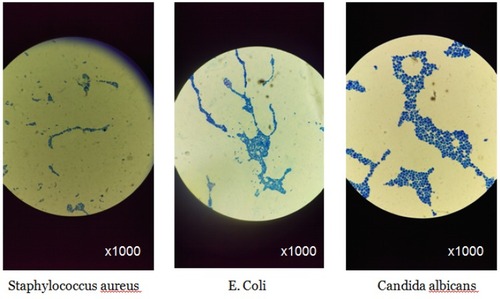
Table 2 Microhardness and Contact Angle Values of the Created Polymer Nanocomposites
Figure 3 Biocompatibility of the polymer nanocomposites. (A) Resting moDCs were cultured for 24 hours on the surface of the prepared, UV-sterilized polymer nanocomposites in the presence or absence of LPS. At the end of incubation, cells were harvested to measure the viability of moDC by flow cytometry. (B) A number of cultured human Lactobacillus reuteri ATCC 6475 bacteria on the investigated materials. CFU=colony forming units (bacteria with the ability to proliferate). Mean values were calculated from 3 independent experiments with duplicates +SD.
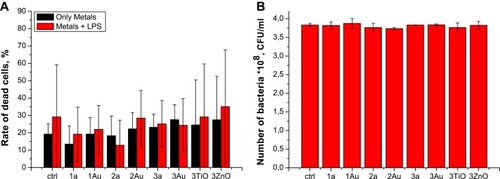
Table 3 The Sorption of Microorganisms on the Surface of Different Polymer Nanocomposites
Figure 4 Luminescence spectra of the investigated samples with and without ErO nanoparticles.
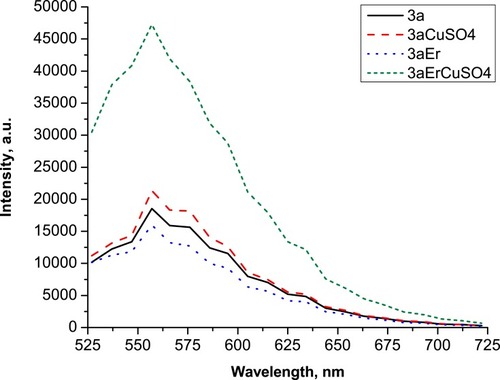
Table 4 The Contact Angle Values of Thin Layer and Surface Structures Based on Polymer Nanocomposites