Figures & data
Figure 1 Structure of cordycepin (A) and adenosine (B) obtained from the Pubchem database showing similarity.
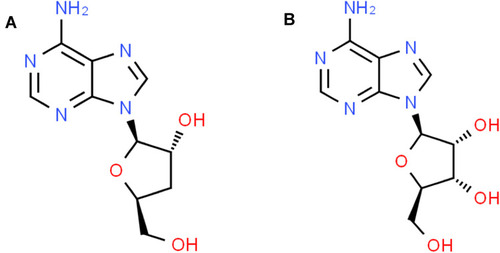
Table 1 Drug, Polymer, Solvent and Stabilizer Composition in Various Batches Tested for the Production of CPNPs
Figure 2 (A) Transmission electron micrograph showing cordycepin-loaded PLGA nanoparticles (CPNPs) of C3 formulation and (B) Histogram showing the size distribution of CPNPs in the formulation.
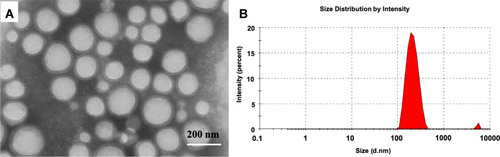
Figure 3 HPLC chromatogram of standard cordycepin (A), UV spectrum of standard cordycepin (B), HPLC chromatogram of cordycepin extracted from CPNPs (C) and, UV spectrum of cordycepin extracted from CPNPs (D).
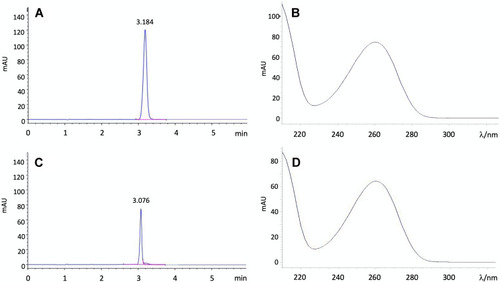
Table 2 Average Particle Size, Size Distribution, Zeta Potential and Encapsulation Efficiencies of CPNPs Obtained from Various Formulations
Figure 4 In vitro release profile of cordycepin from CPNPs in PBS at pH 7.4 (mean ± SD, n = 3). Statistical analysis of data was performed using two-way ANOVA, followed by Bonferroni post hoc test. C2 vs C3: *p<0.05, ***p<0.001; C1 vs C2: $p<0.05; C2 vs C4: #p<0.05.
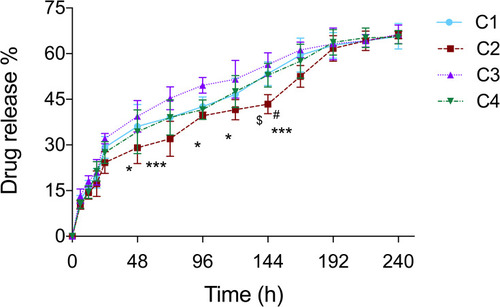
Figure 5 Comparison of cytotoxic potential of free cordycepin and CPNP in MCF-7 cells (mean ± SD, n = 3). Statistical analysis of data was performed using two-way ANOVA, followed by Bonferroni post hoc test. Cordycepin vs CPNPs (**p<0.01, ***p<0.001).
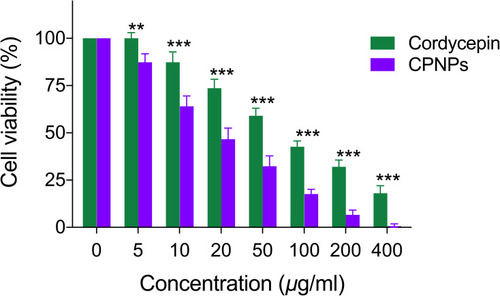
Figure 6 Uptake of curcumin (A) and curcumin loaded PLGA nanoparticles (B) by MCF-7 cells after 4 h of incubation as revealed by green fluorescence under the confocal microscope.
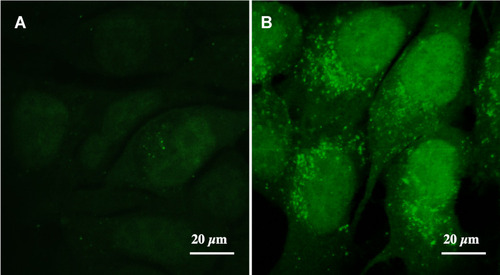
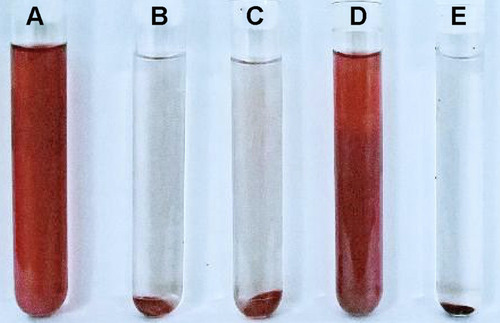
Figure 7 Effect of free cordycepin and CPNPs on the hemolysis of in rat RBCs. (A) distilled water; (B) normal saline; (C) 50 µg/mL free cordycepin; (D) 100 µg/mL free cordycepin; (E) 100 µg/mL CPNPs.