Figures & data
Table 1 Details of the Housekeeping Genes Tested for Their Stability After Gold and Silver NP Treatment
Figure 1 Size distribution of silver (A) and gold (B) NPs used in the present study.
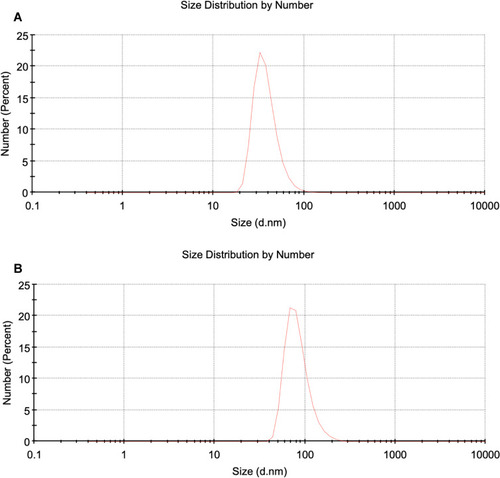
Figure 2 UV-VIS spectra of NPs diluted in MS medium.
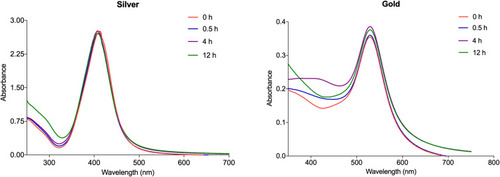
Table 2 Mean Particle Size, Polydispersity Index and Zeta Potential of the NPs
Figure 3 H. perforatum cell suspension cultures after NP treatment. Control cultures remained yellowish-green throughout the experimental period ((A) 0.5 h, (B) 4 h (C) and 12 h), whereas cultures gradually darkened with time in the presence of gold ((D) 0.5 h, (E) 4 h, and (F) 12 h), and silver ((G) 0.5 h, (H) 4 h and (I) 12 h), NPs.
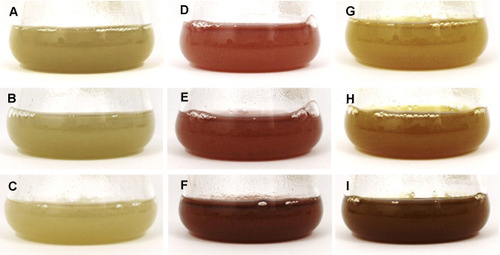
Figure 4 Trypan blue staining of control (A), and cultures treated with gold (B) and silver (C) NPs after 12 h showing cell viability.
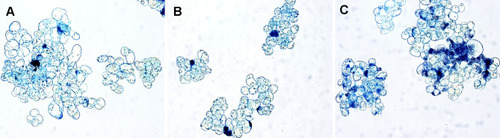
Figure 5 BoxPlot showing Ct values of the housekeeping genes in experimental samples taken at 0.5 h (A), 4 h (B) and 12 h (C) post-treatment time points. The line across the box is the median value, whereas the 25th percentile to the 75th percentile is indicated by the lower and upper boxes. The maximum and minimum values are represented by Whiskers.
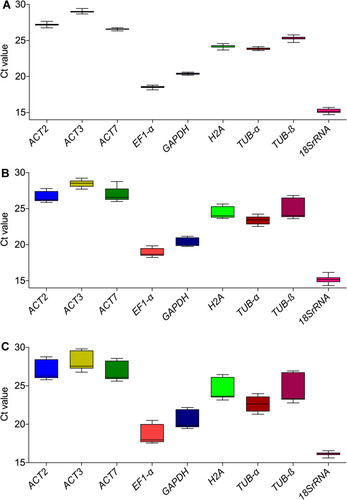
Figure 6 Heatmap constructed by hierarchical clustering analysis (HCA) of Ct values of ACT2, ACT3, ACT7, EF1-α, GAPDH, H2A, TUB- α, TUB-β and 18SrRNA genes in control (C), and gold (G) and silver (S) NPs treated cultures at 0.5 h (0.5), 4 h (4) and 12 h (12) post-treatment in three biological replications (A-C). Red color represent positive values or higher Ct values and blue color represents negative values or low Ct values.
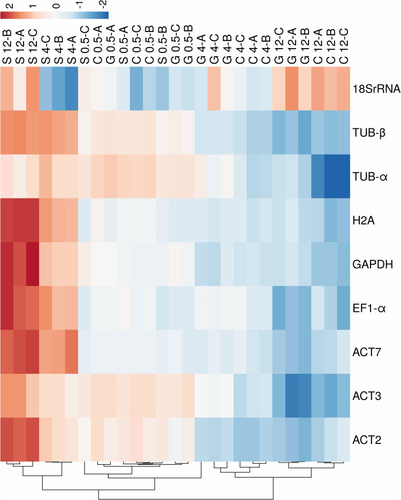
Table 3 Comprehensive Stability Ranking of Genes Based on RefFinder Analysis at Various Time Points After NP Treatment of H. perforatum Cells
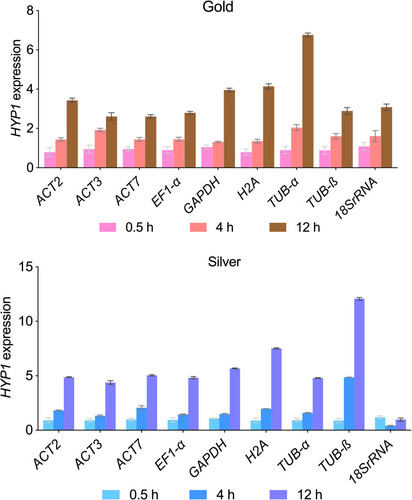
Figure 7 Gold and silver NPs induced HYP1 gene expression in H. perforatum cells after normalization with the expression of housekeeping genes.