Figures & data
Figure 1 Effect of passive adsorption of BSA on aggregation and surface potential of FDP-NV functionalized with carboxyl groups and suspended in water, culture medium and biological buffers, respectively.
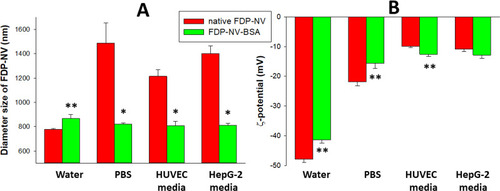
Figure 2 Effect of FDP-NV on HepG-2 cell proliferation determined by direct evaluation of cell numbers after 24 hours.
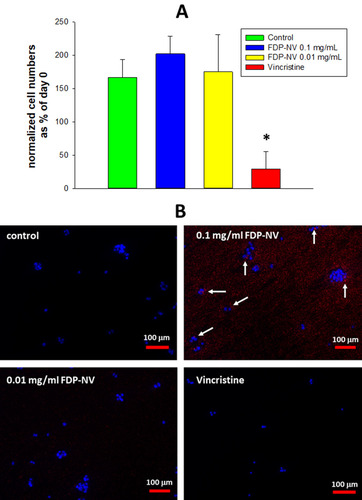
Figure 3 Effect of FDP-NV on HUVEC proliferation determined by direct evaluation of cell numbers after 24, 48 and 72 hours.
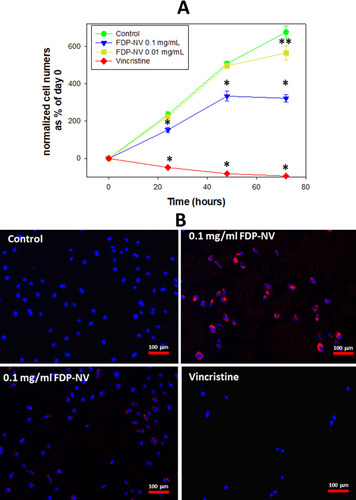
Figure 4 Effect of FDP-(NV) on HepG-2 (A) and HUVEC (B) NADPH-dependent oxidoreductase activity tested in the MTT assay.
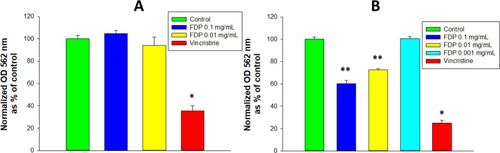
Figure 5 Effect of FDP-(NV) on HepG-2 (A) and HUVEC (B) cytoplasmic esterase activity monitored using the calcein AM assay.
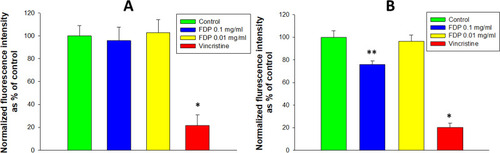
Figure 6 Effect of FDP-NV on the migration of HUVEC stimulated by 2% FBS in a scratch assay.
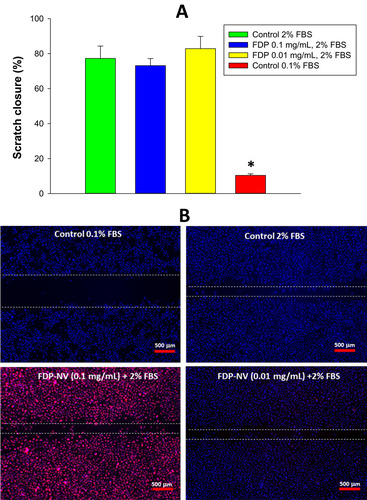
Figure 7 Effect of FDP-NV on the phosphorylation of MAPK Erk1/2 induced by FBS.
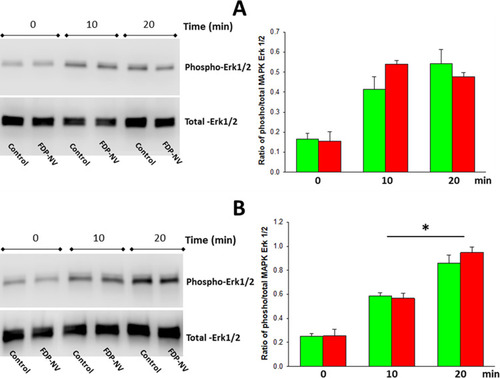
Figure 8 Identification of phospho- and total-MAPK Erk1/2 in the cytoplasm and nuclei of HepG-2 cells and HUVEC in the presence and absence of FDP-NV and TPA.
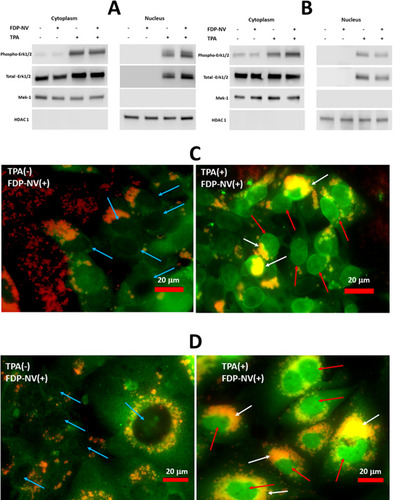
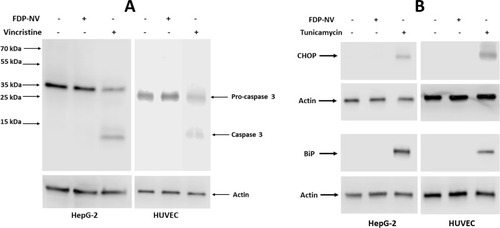
Figure 9 Effect of FDP-NV on the induction of apoptosis and ER stress in HepG-2 cells and HUVEC.