Figures & data
Figure 1 Viability of different pancreatic cell lines after SPION treatment. Cells were incubated for 24 h with 100 µgFe/mL SPIONLA-BSA. Cell viability was determined by Annexin V-FITC/propidium iodide (AxV/PI) staining and analyzed by flow cytometry. The amount of viable (AxV-PI-), apoptotic (AxV+PI-) and necrotic (PI+) cells are shown for SUIT-2, PaCa DD183, PANC-1, PANC-1SMAD4 (1−4) and PANC-1SMAD4 (2−6). Toxicity controls contain 2% DMSO, negative controls represent the corresponding amount of H2O instead of water-based ferrofluid. Data are expressed as the mean ± standard deviation (n=4 with technical quadruplicates). Statistical significance in the percentage of viable cells are indicated with *, ** and ***. The respective confidential intervals are p < 0.01, p < 0.005 and p < 0.00002 and were calculated via t-test analysis.
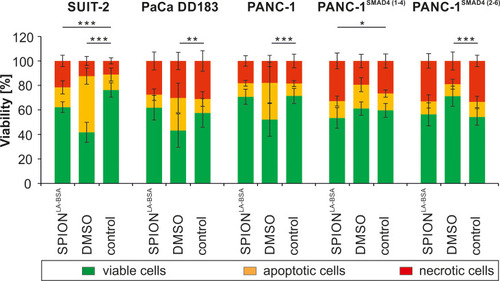
Figure 2 Live-cell-holotomography of cellular nanoparticles. PANC-1SMAD4 (2−6) cells with unlabeled SPIONLA-BSA are visualized by differences in the refractive index. (A) The 2D image shows an X-Y slice of the RI image. (B–E) The 3D RI images represents the same sample under different angles. (C–E) In the 3D RI images, structures with low RI, such as cytoplasm, cell nuclei and nucleoli, were digitally stained in green, whereas structures with high RI, such as SPION clusters, were digitally stained in red. (b-e) Exemplary RI Images with different viewing angles (B) 90° (C) 45° (D) 0° (E) 0° and diagonally cut through the Y-axis).
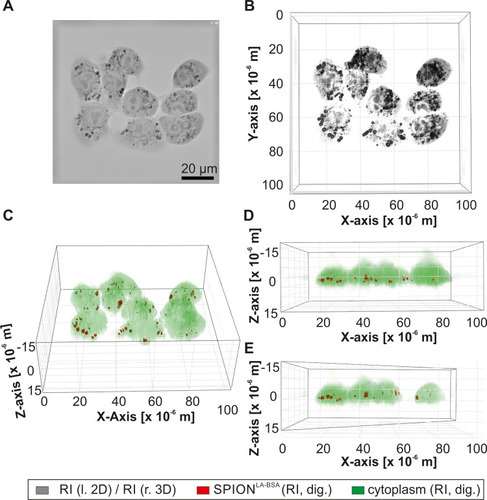
Figure 3 SPION amount determined by holotomographic imaging. SPION accumulations and cell structures were defined as areas of high and low RI, respectively. (A–E) Cell line dependent variations and differences within individual cells in the intensity of areas with high RI. (F) SPION amount as defined by high RI in different pancreatic cell lines treated with and without SPIONLA-BSA particles. Statistical significance are indicated with *, ** and ***. The respective confidential intervals are p < 0.02, p < 0.001 and p < 0.0001 and were calculated via t-test analysis.
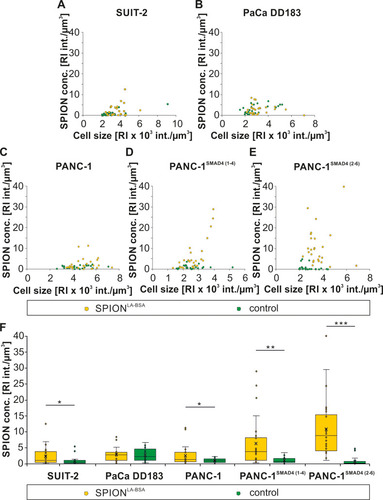
Figure 4 Quantification of cellular nanoparticle load via microwave plasma-atomic emission spectroscopy (MP-AES). Cells were incubated for 24 h with 100 µgFe/mL SPIONLA-BSA and cell lysates were investigated by MP-AES. The cellular iron concentration (pgFe/cell) is shown for SUIT-2, PaCa DD183, PANC-1, PANC-1SMAD4 (1−4) and PANC-1SMAD4 (2−6). Control samples contain the corresponding amount of H2O or DMSO with a final concentration of 2% instead of water-based ferrofluid. The data are expressed as the mean ± standard deviation (n=4 with technical quadruplicates). Statistical significance are indicated with ** and ***. The respective confidential intervals are p < 3x10⁻⁹ and p < 2x10⁻¹⁹ and were calculated via t-test analysis.
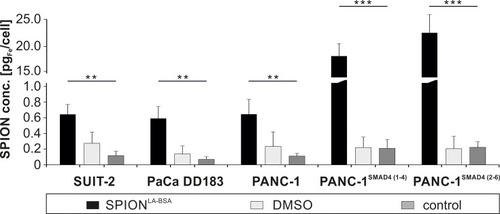
Figure 5 SPION load visualized by optical imaging. PANC-1 cells were treated with unlabeled SPIONLA-BSA (100 µgFe/mL) or with the corresponding amount of H2O or DMSO (final concentration of 2%) for 24 h and visualized by (A) fluorescent staining for nuclei (Hoechst 33342, red) and actin cytoskeleton (Alexa Fluor 488 Phalloidin, green), (B) differential interference contrast (DIC) and (C) phase contrast. Compared to few spots with high contrast within control and DMSO samples, numerous areas of high contrast indicate SPION accumulations within vesicles in nanoparticle-treated cells.
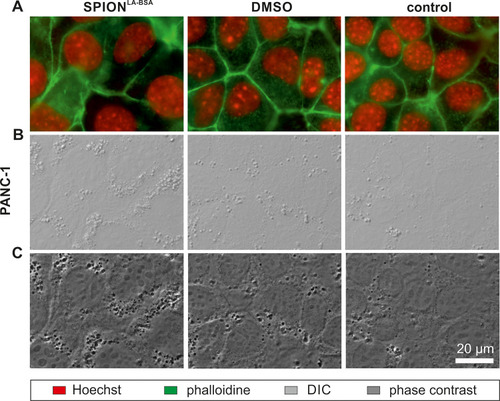
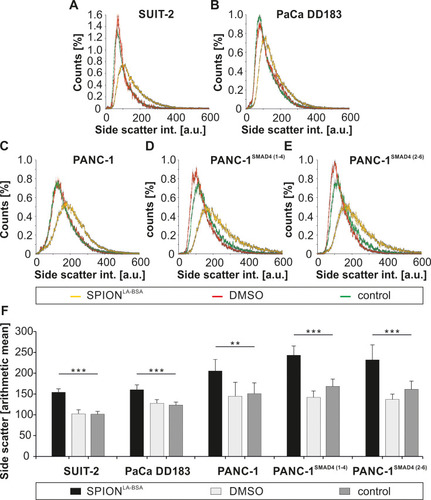
Figure 6 Cellular side scatter increase after SPION treatment measured by flow cytometry. (A–F) Pancreatic cell lines were treated with SPIONLA-BSA (100 µgFe/mL) for 24 h and analyzed by flow cytometry. Control samples contained the respective amount of ultrapure water and the toxicity control 2% DMSO. (A–E) Distribution of the cellular SSC intensity. The total cell numbers of each sample were set to 100%. Grey error bars indicate the standard error of n=4 with quadruplicates. (F) The arithmetic mean of the SSc intensity in different pancreatic cell lines. Error bars indicate the standard deviation of n=4 with quadruplicates. Statistical significance are indicated with ** and ***. The respective confidential intervals are p < 2x10⁻⁴ and p < 2x10⁻⁷ and were calculated via t-test analysis.