Figures & data
Figure 1 Cell compartments and the locations of cuproenzyme formation that are targeted by Cu(I)/Ag(I) transport; data from Puchkova et al.Citation37 At least three proteins in the cell membrane can import silver ions to the cell, CTR1, CTR2, and DMT1, as well as an unidentified proton pump (red); data from Logeman et al,Citation38 and Zimnicka et al.Citation39 Inside the cell, Ag(I) is bound by the cytosolic Cu(I)-chaperons ATOX1 and CCS but not by COX17. However, CCS is unable to insert Ag(I) into the active center of SOD1 (purple), as the ligands of the SOD1 active site are not favorable for Cu(I)/Ag(I). Ag(I) ions, bound by ATOX1, may be translocated by copper-transporting ATPases (ATP7A/B) to the lumen of the Golgi complex (TGN), which is the site of the formation of secretory cuproenzymes (orange). There, Ag(I) can be inserted into the active centers of cuproenzymes, which can favorably coordinate Cu(I)/Ag(I) (blue). The molecules that transport Ag(I) to the nucleus and mitochondria and correspond to silver accumulation in these compartments have not yet been identified. The solid arrows indicate established routes of Ag(I) traffic, and the dashed arrows indicate putative routes.
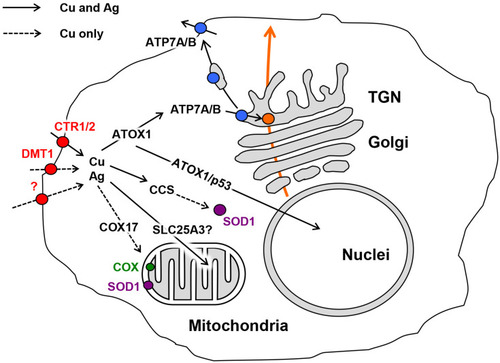
Figure 2 Some physicochemical properties of fabricated AgNPs. Columns correspond to AgNPs of different sizes: (A) UV/Vis absorption spectra of aqueous suspensions of AgNPs; (B) images of AgNPs obtained by transmission (AgNP10 and AgNP20) or scanning electron microscopy (AgNP75); (C) distribution of the AgNPs by their diameter as measured using laser diffractometry; (D) sedimentation of AgNPs during centrifugation; abscissa, time, min; ordinate, % of initial silver content in the supernatant suspension.
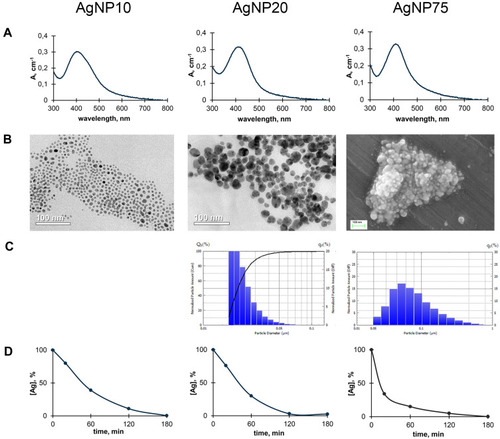
Figure 3 Time-dependent antibacterial effects of the AgNPs at [Ag] 20 μM. (A) colony-forming ability of Escherichia coli cells on agar plates at various times of incubation with AgNPs of different size; (B) bar charts showing survival of E. coli cells as a function of time of treatment with AgNPs. CFU – colony-forming unit.
![Figure 3 Time-dependent antibacterial effects of the AgNPs at [Ag] 20 μM. (A) colony-forming ability of Escherichia coli cells on agar plates at various times of incubation with AgNPs of different size; (B) bar charts showing survival of E. coli cells as a function of time of treatment with AgNPs. CFU – colony-forming unit.](/cms/asset/a6813154-61c8-4a5e-b782-977462127961/dnsa_a_12173927_f0003_c.jpg)
Figure 4 Time-dependent antibacterial effects of the AgNPs at [Ag] 200 μM. (A) Escherichia coli colony-forming ability on agar plates at various periods of incubation with AgNPs of different size; (B) bar charts showing survival of E. coli cells as a function of time of treatment with AgNPs. CFU – colony-forming unit.
![Figure 4 Time-dependent antibacterial effects of the AgNPs at [Ag] 200 μM. (A) Escherichia coli colony-forming ability on agar plates at various periods of incubation with AgNPs of different size; (B) bar charts showing survival of E. coli cells as a function of time of treatment with AgNPs. CFU – colony-forming unit.](/cms/asset/db8c9495-594d-4e24-af9c-d52ff7ad03bf/dnsa_a_12173927_f0004_c.jpg)
Figure 5 Copper and silver distribution in murine body during treatment with AgNPs. (A) dark silver-containing inclusions in mesentery. (B) silver content in the inclusions and surrounding tissue, 1) regular spotless tissue, 2) periphery of the spot, 3) central part of the spot. (C) silver and (D) copper concentrations in different organs (µg/g tissue) after daily AgNP injections for seven days. In the organs of the control mice, silver content did not exceed 10 ng/g tissue.
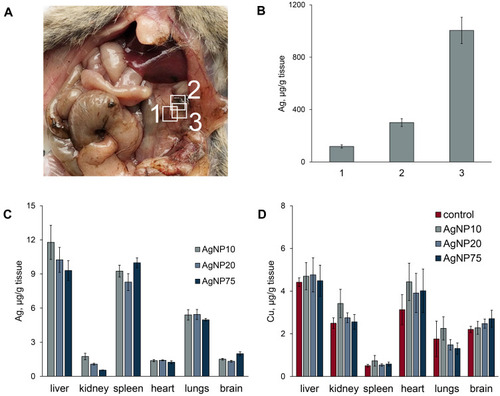
Figure 6 Influence of AgNP treatment on copper status indexes in mice. (A) and (B)–concentrations of silver and copper in blood serum, where red bar denotes control (untreated) mice (C) Cp oxidase activity of blood serum of treated mice, where red bar denotes control mice; ordinate, oxidase activity, % of control (n = 5 animals per group). Inset: image section of gel, stained by o-dianisidine, 1 µL serum per lane, samples from three random mice in each group. (D) Cp protein content, % from control. Inset: immunoblotting of blood sera (0.2 μL per lane) with antibodies to Cp, the samples are the same as in section (C), abscissa, days after the first injection. *value differs from control group at the P < 0.05 level.
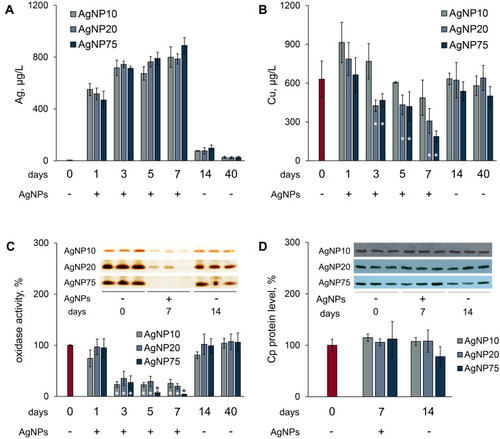
Figure 7 Chromatographic profiles (gel-filtration) of copper and silver distribution in blood serum of untreated mice (A) and mice treated with AgNP75 (B); 2 mL of serum were loaded on the column. Inserts: oxidase activity and immunoreactive Cp in the fractions.
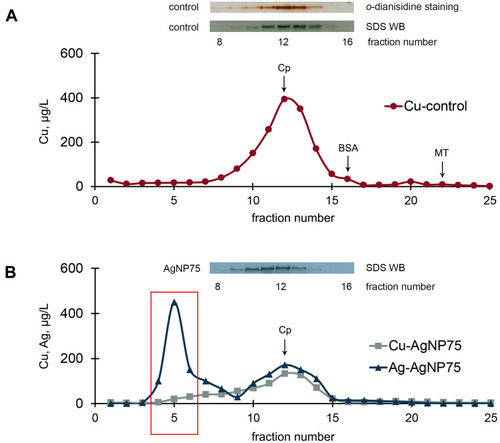
Figure 8 Interaction of AgNPs with BSA (A) and Cp (B) in vitro studied with UV/Vis spectroscopy. (C) PAGE in denaturing reducing conditions of Cp and BSA. (D) non-denaturing PAGE of Cp (o-dianisidine staining) and BSA (Coomassie staining), with changes in UV/Vis spectra of serum fractions #4 (E) and #5 (F) during incubation with AgNPs. (G) PAGE in denaturing reduced conditions of blood serum fractions #4–6 from control mice.
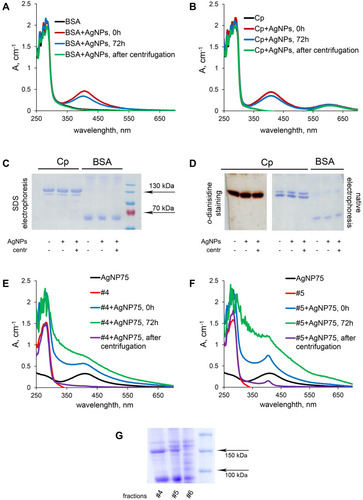
Figure 9 Excretion of silver from mice, treated with AgNPs. Dynamics of silver concentration in liver (A); detection of silver in urine (B), and bile (C). (D) fraction of copper and silver in bile, which is associated with Cp (%). Pools of bile samples were collected by a syringe from the gall bladders of mice, which received AgNP75 injections daily for seven days. Cp was precipitated by antibodies to murine Cp. (E) blood serum (0.1 μL) and bile (10 μL) samples were subject to non-denaturing electrophoresis in 8% PAG; the proteins were transferred to the membrane and analyzed with antibodies to murine Cp; arrow, position of oxidase murine blood serum Cp in the gel.
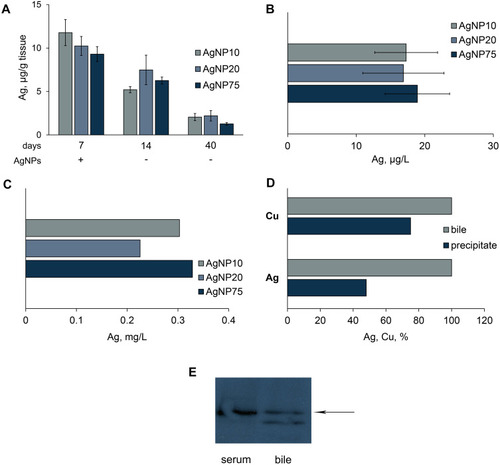
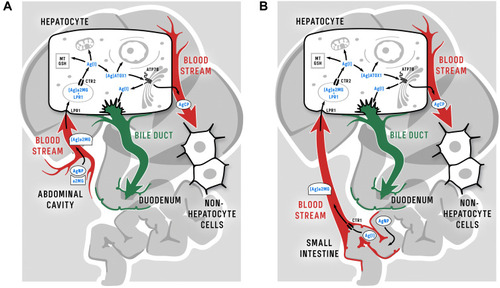
Figure 10 Schema of putative routes of nanoparticle silver following intraperitoneal (A) and oral (B) injection of AgNPs in mammalian organism and inside hepatocytes. The only difference between the intraperitoneal and oral delivery of silver from nanoparticles into the bloodstream is that silver is transported through enterocytes using CTR1 when administered orally (see text for details). It should be noted that in humans, rats, and mice the roles of α2MG in Cu(II) transport may be different; data from Hellman and Gitlin,Citation63, Cabrera et al,Citation77 and Garcia-Ferrer et al.Citation84