Figures & data
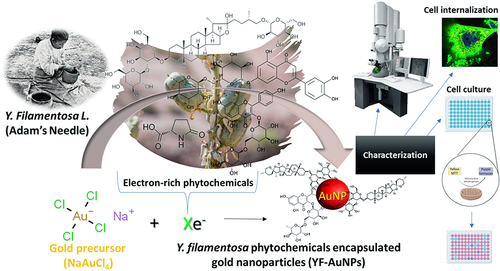
Figure 1 LC-MS/MS spectra of Y. filamentosa water extract.
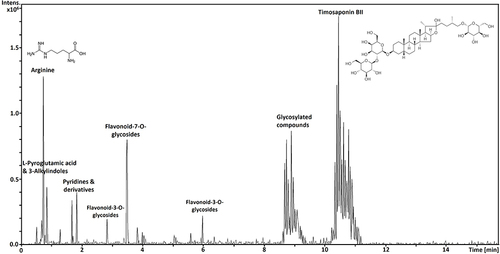
Figure 2 LC-MS/MS phytochemical composition pie chart of Y. filamentosa extract.
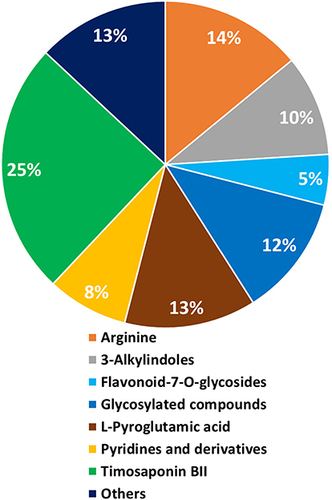
Figure 3 Ultraviolet-visible spectra of (a) YF-AuNPs and (b) GAYF-AuNPs.
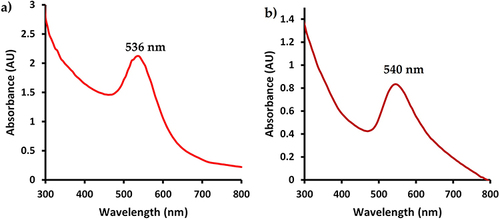
Figure 4 Proposed mechanism of Y. Filamentosa extract phytochemical oxidation to produce Y. filamentosa gold nanoparticles (YF-AuNPs) and the Au3+ reduction to Au0 nanoparticle.
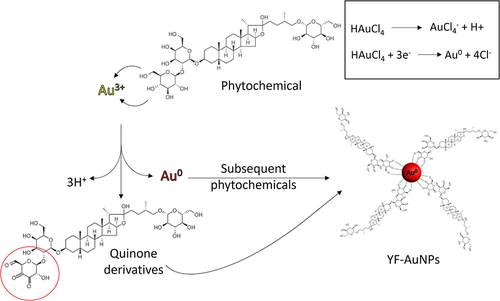
Figure 5 FTIR and XRD analysis of gold nanoparticles, (a) FTIR spectra indicated Y. filamentosa extract phytochemicals with the gold nanoparticle surface, acting as both a reducing and stabilizing ligand for the nanoparticles and (b) XRD spectra revealed crystalline nanoparticles represented by four peaks corresponding to standard Bragg reflections (111), (200), (220), and (311) of face-centered cubic lattice. The intense peak at 38.1 represents preferential growth in the (111) direction.
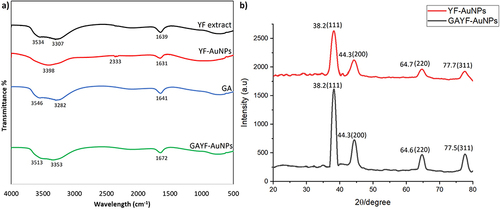
Table 1 Physicochemical Properties of YF-AuNPs and GAYF-AuNPs
Figure 6 Ultraviolet-visible spectra for the in vitro stability of (a) YF-AuNPs and (b) GAYF-AuNPs.
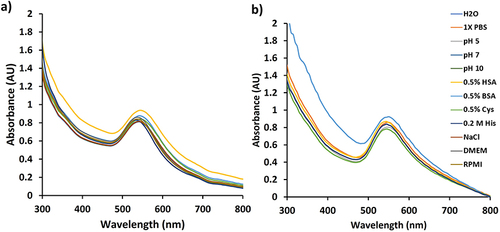
Figure 7 TEM image of (a) YF-AuNPs and (b) GAYF-AuNPs and size distribution graph.
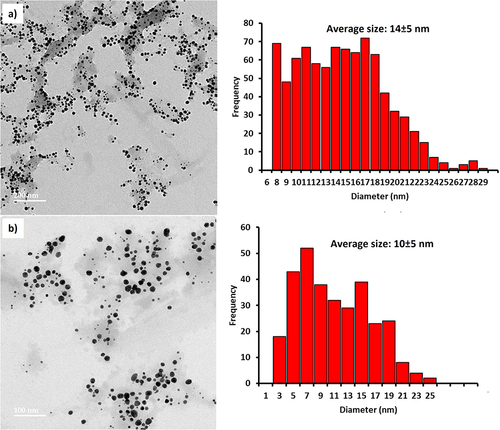
Figure 8 Confocal microscopy images of YF-AuNPs (50 μg/mL): cellular internalization in (a) PC-3 and (b) MDAMB-231 cells after 24 hr incubation. The cytoplasm (green – WGA labeling), nucleus (blue – DAPI stain) and YF-AuNPs (yellow) seen.
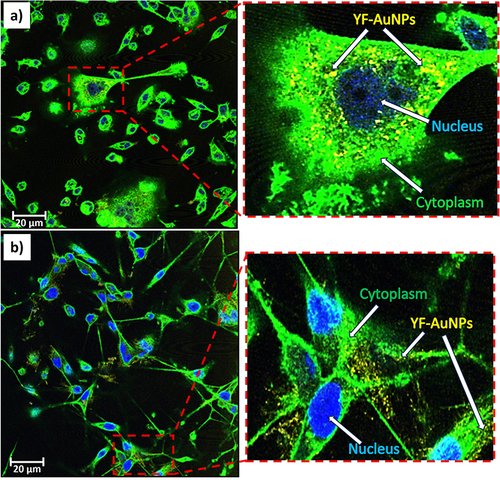
Figure 9 Confocal microscopy images of YF-AuNPs (50 μg/mL): cellular internalization in (a) RAW 264.7 and (b) HAEC cells after 24 hr incubation. The cytoplasm (green – WGA labeling), nucleus (blue – DAPI stain) and YF-AuNPs (yellow) seen.
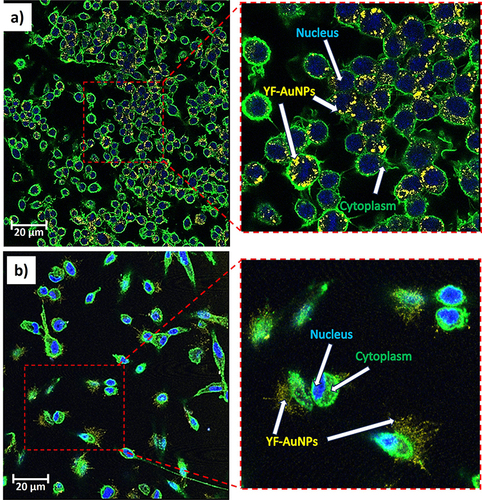
Figure 10 TEM images for cellular internalization (a) PC-3 (untreated control), (b) PC-3 treated with YF-AuNPs (50 μg/mL) 24 hr post-incubation, (c) MDAMB-231 (untreated control), and (d) MDAMB-231 treated YF-AuNPs (50 μg/mL) 24 hr post-incubation. The red circle indicates the color of the cell pellets and the size distribution of YF-AuNPs at 14.8±4.3 and 15.7±4.3 nm for PC-3 and MDAMB-231, respectively.
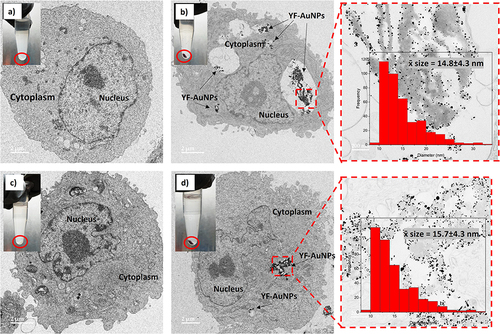
Figure 11 TEM images for cellular internalization (a) RAW 264.7 (untreated control), (b) RAW 264.7 treated with YF-AuNPs (50 μg/mL) 24 hr post-incubation, (c) HAEC (untreated control), and (d) HAEC treated YF-AuNPs (50 μg/mL) 24 hr post-incubation. The red circle indicates the color of the cell pellets and the size distribution of YF-AuNPs at 17.5±5.4 and YF-AuNPs located outside the HAEC cells, revealing no cellular internalization, respectively.
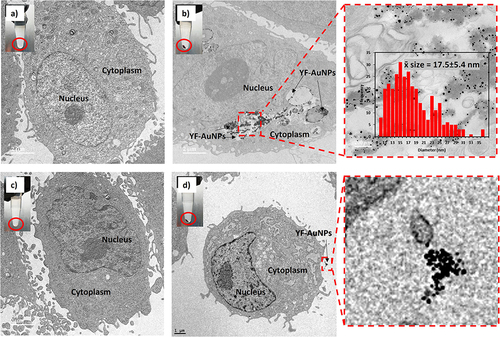
Table 2 IC50 Values of YF-AuNPs and Cisplatin Against PC-3, MDAMB-231, and HAEC Cells
Figure 12 Anti-cancer efficacy of YF-AuNPs against PC-3 cells.
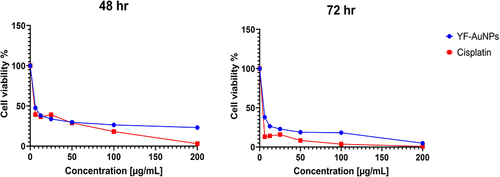
Figure 13 Anti-cancer efficacy of YF-AuNPs against MDAMB-231 cells.
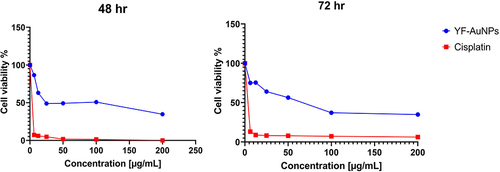
Figure 14 Anti-cancer efficacy of YF-AuNPs against HAEC cells.
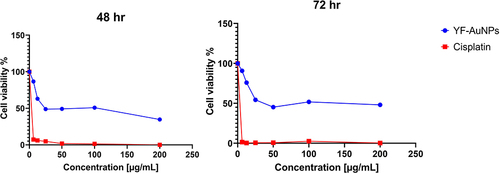
Figure 15 Confocal microscopy images of apoptosis and necrosis of PC-3 and MDAMB 231 cells with no treatment (CTL) and after treatment with staurosporine (STS) and YF-AuNPs. (A) Healthy cells, (B) early apoptosis, (C) late-apoptosis, and (D) necrotic cells.
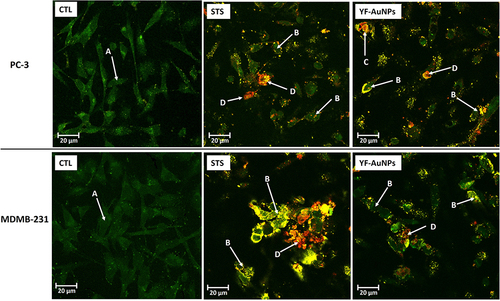
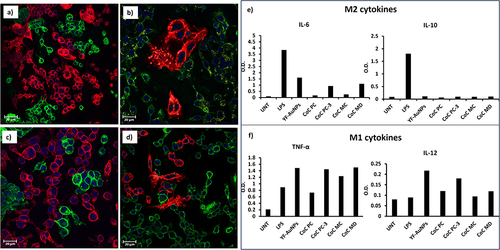
Figure 16 Confocal microscopy images of (a) co-culture of PC-3 cell lines (red) and naive RAW 264.7 macrophage cell line (green); (b) co-culture of PC-3 cell lines (red) and YF-AuNPs pre-treated RAW 264.7 macrophage cell line (green); (c) co-culture of MDAMB 231 cell lines (red) and naive RAW 264.7 macrophage cell line (green); and (d) co-culture of MDAMB 231 cell lines (red) and YF-AuNPs pre-treated RAW 264.7 macrophage cell line (green) demonstrated an ability of YF-AuNPs activated RAW 264.7 macrophage cell line to suppress the growth of prostate and breast tumor cells. Immunomodulatory activity of YF-AuNPs showed (e) reduced levels of pro-tumor cytokines (IL-6 and IL-10) and (f) elevated levels of anti-tumor cytokines (TNF-α and IL-12) indicative of a polarization shift in the macrophage phenotype from pro-tumor M2 to anti-tumor M1.