Figures & data
Figure 1 One molecule loaded in silicon-nanostructure (before minimization). The box inside silicon nanochambers shows the typical docking space.
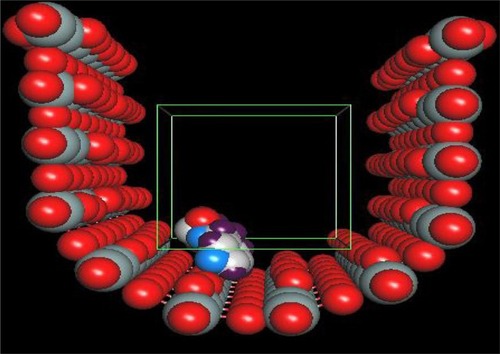
Table 2 The neural network architectures produced with the descriptors for bio-active compound with the error limit of <0.05
Table 1 Names of drugs and bioactive molecules used in this study
Figure 2 The highest interacting molecules according to the interaction energies (kcal/mol): In each cell the numbers show the IE (kcal/mol).
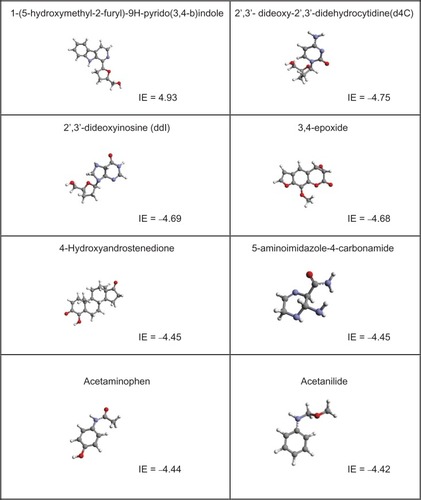
Figure 3 The relationship between size of molecules and interaction energy.
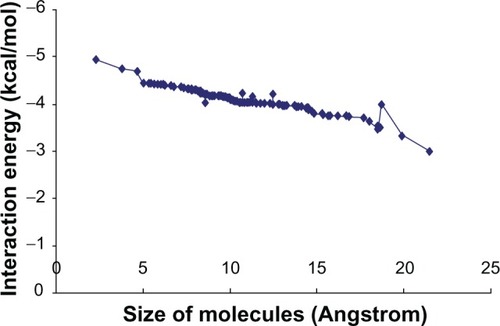
Figure 4 The relationship between Log P and interaction energy.
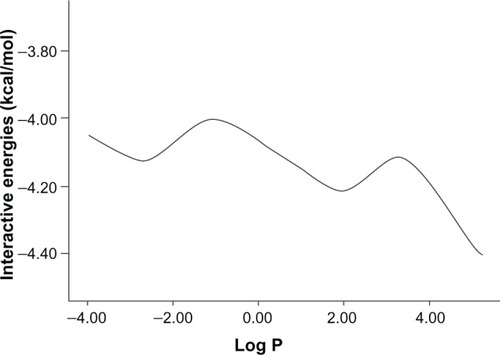
Figure 5 The relationship between hydration energies and interaction energy.
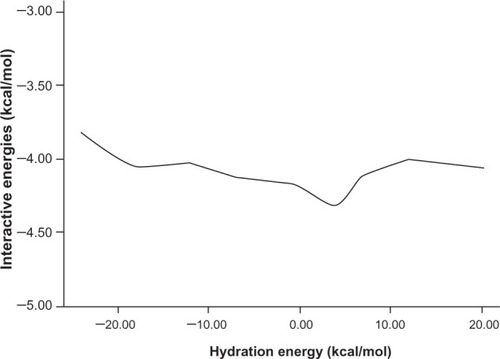
Figure 6 The relationship between molar refractivity and interaction energy.
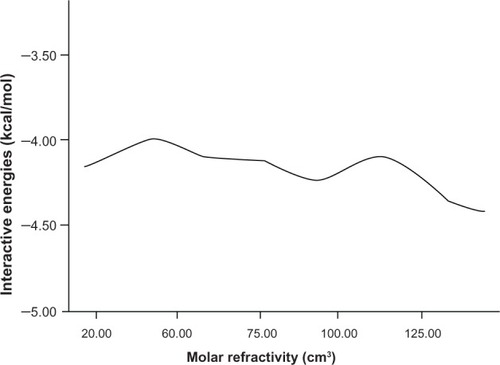
Figure 7 The relationship between surface tension and interaction energy.
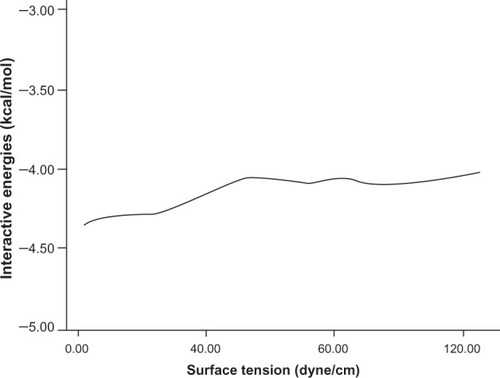
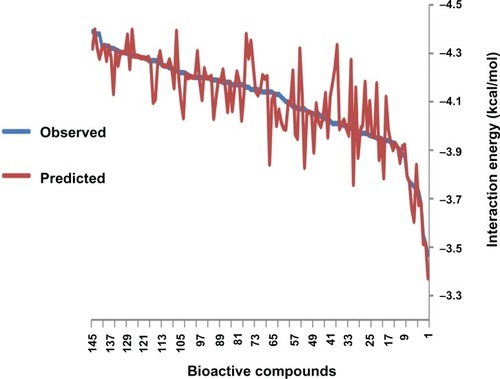
Figure 8 Predicted activity versus observed values obtained by architecture 11-7-1.