Figures & data
Figure 1 Seven hierarchical levels of organization of the bone family of materials.
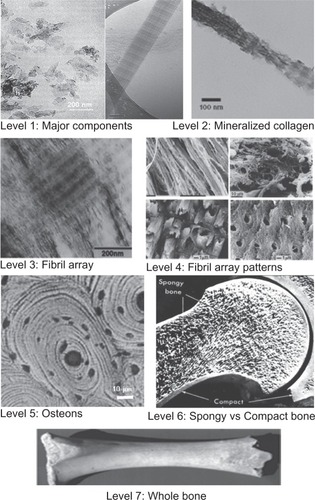
Table 1 Characterization of bone crystallites using different analytical methods
Figure 2 Hierarchical architecture of mammalian enamel. Enamel (E) is the outermost layer at the crown of the tooth and resides above the dentin (D). The pulp (P) contains nerves and blood vessels, while the cementum (C) is the outermost layer of mineralized tissue surrounding the root of the tooth allowing the tooth to be anchored to the jawbone through the periodontal ligament (PDL). The bulk image depicts the enamel organ, the transition across the dentin–enamel junction, and the dentin below. On the mesoscale level, prismatic enamel consisting of weaving of rods (or prisms) that range from 3 to 5 μm in diameter can be visualized. Upon further magnification, the micrometer scale shows the composition of a single rod. The nanometer scale reveals a highly organized array of individual HA crystallites (~30 nm thick, 60 nm wide, and several millimeters in length), which are preferentially aligned along the c-axis.
Copyright (c) 2008, MRS Bulletin Reproduced with permission from Tamerler C, Sarikaya M. Molecular biomimetics: genetic synthesis, assembly, and formation of materials using peptides. MRS Bull. 2008;33(5):504–510.
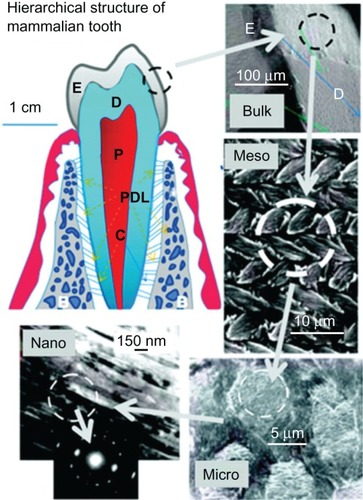
Figure 3 Scanning electron microscopy image of enamel-carbonated hydroxyapatite. ‘Spaghetti-shaped nanocrystals’ arranged in bundles oriented along three differentdirections (scale bar 10 μm).
Copyright (c) 1989, Oxford University Press. Reproduced with permission from Lowestan HA, Weiner S. On Biomineralization. New York: Oxford University Press; 1989.
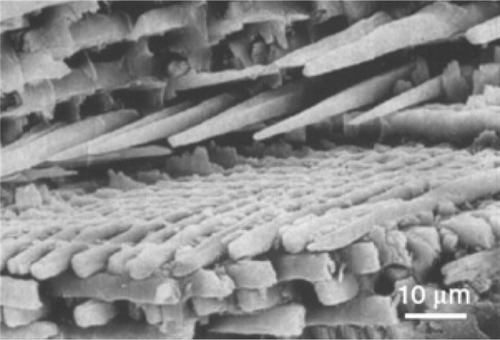
Figure 4 X-ray diffraction profiles of biologic apatites from A) bone, B) dentin, and C) enamel. The sharper diffraction peaks in C compared to either B or A indicate that enamel apatite crystals are much larger compared to either bone or dentin apatite crystals.
Copyright (c) 2008, American Chemical Society. Reproduced with kind permission from LeGeros RZ. Calcium phosphate-based osteoinductive materials. Chem Rev. 2008;108(11):4742–4753.
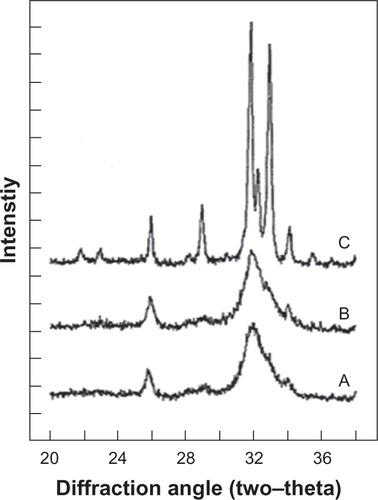
Table 2 Comparative composition and structural parameters of inorganic phases of adult human calcified tissues
Figure 5 Scanning electron microscopy images of porous hydroxyapatite.
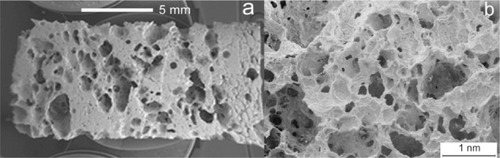
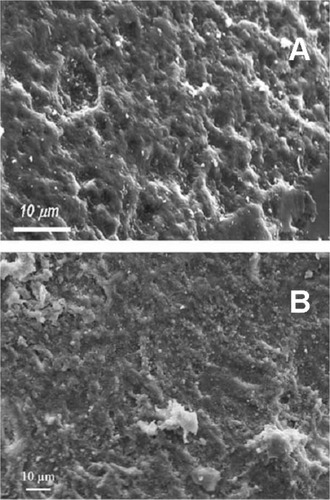
Figure 6 Scanning electron microscopy image of wood silicon carbide. Transversal cross-sectioned sample A) before and B) after electrochemically assisted biomimetic hydroxyapatite/collagen surface deposition. Copyright (c) 2010, Wiley-VCH Verlag GmbH & Co. KGaA. Reproduced with permission from Lelli M, Foltran I, Foresti E, et al. Biomorphic silicon carbide coated with an electrodeposition of nanostructured hydroxyapatite/collagen as biomimetic bone filler and scaffold. Adv Eng Mater. 2010;12(8):B348–B355.
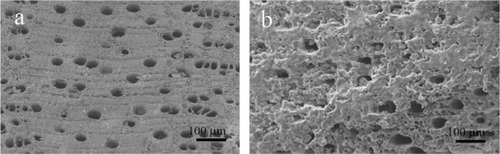
Figure 7 A processing scheme to convert wood hierarchical structures to new biomimetic hydroxyapatite scaffolds. Copyright (c) 2009, Royal Society of Chemistry. Tampieri A, Sprio S, Ruffini A, Celotti G, Lesci IG, Roveri N. From wood to bone: multi-step process to convert wood hierarchical structures into biomimetic hydroxyapatite scaffolds for bone tissue engineering. J Mater Chem. 2009;19:4973–4980.
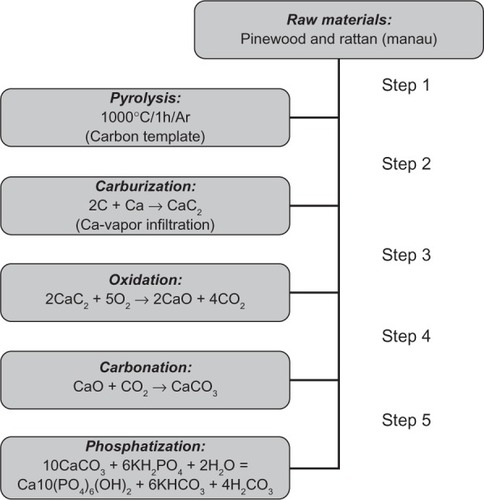
Figure 8 Detailed scanning electron microscopy images of pinewood-derived hydroxyapatite. A) Microstructure of wood-derived parallel fastened hydroxyapatite microtubes. B) Typical needlelike HA nuclei grown on the microtube surface; the inset shows a higher magnification of B. Copyright (c) 2009, Royal Society of Chemistry. Tampieri A, Sprio S, Ruffini A, Celotti G, Lesci IG, Roveri N. From wood to bone: multi-step process to convert wood hierarchical structures into biomimetic hydroxyapatite scaffolds for bone tissue engineering. J Mater Chem. 2009;19:4973–4980.
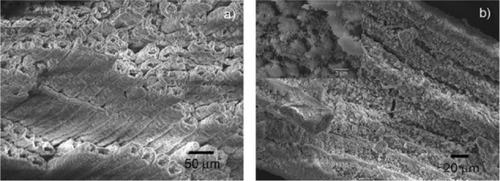
Figure 9 Scanning electron microscopy image of collagen fibrils–hydroxyapatite nanocrystals hybrid coating after decalcification in a 10-wt% EDTA solution for 24 h. Scale bar is 5 μm.
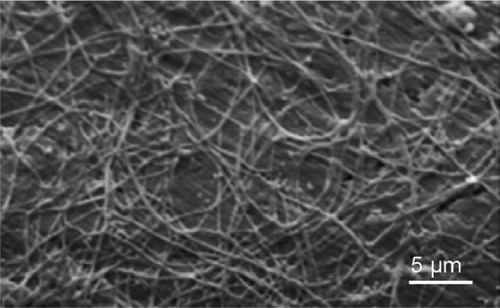
Figure 10 TEM image of surface nanostructured biomimetic carbonate-hydroxyapatite microcrystals.
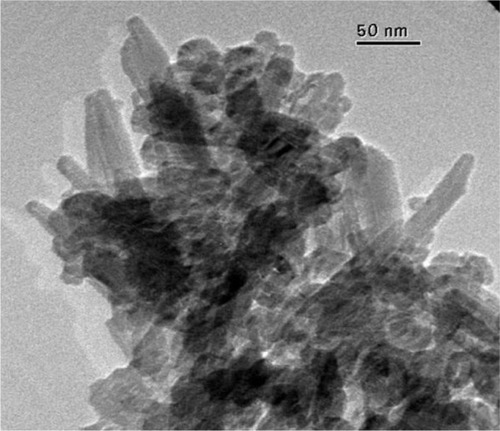
Figure 11 Powder X-ray diffraction patterns of biomimetic carbonate-hydroxyapatite microcrystals (red) compared with the powder X-ray diffraction patterns of dentine apatite (blue).
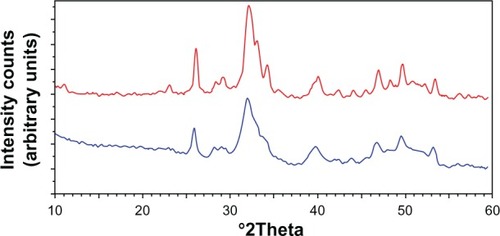
Figure 12 Scanning electron microscopy images of enamel surface after application of A) ortophosphoric acid and B) CHA-contained toothpaste.