
Figures & data
Table 1 Fabric characteristics of sleepwear
Figure 1 Temperature changes during sleep for one participant from bedtime to wake time.
Abbreviations: Distal, distal skin temperature; Proximal, proximal skin temperature; Core, core body temperature; DPG, distal–proximal temperature gradient; DCG, distal–core temperature gradient.
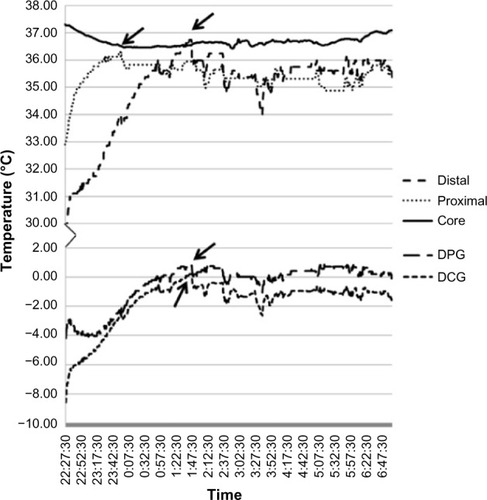
Table 2 Mean ± SD for sleep variables of SOL, TST, and SE sleeping in wool or cotton sleepwear averaged across ambient temperature and bedding type
Table 3 Effect of ambient temperature conditions on proportion of each sleep stage (mean ± SD) averaged across sleepwear and bedding type
Figure 2 Effect of sleepwear and ambient temperature on SOL (A), %N2 (B), and %N3 (C).
Abbreviations: SOL, sleep onset latency; min, minute; N2, sleep stage 2; N3, sleep stage 3.
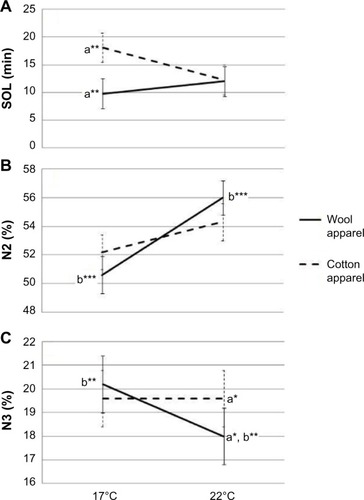
Figure 3 Temperature predictors of sleep onset latency. The predictors are M-proxTsk (A), M-disTsk (B), DCG (C), R-Tc (D).
Abbreviations: M-proxTsk, the magnitude of change in proximal skin temperature; M-disTsk, the magnitude of change in distal skin temperature; DCG, distal–core body temperature gradient; R-Tc, the rate of change in core body temperature; min, minute.
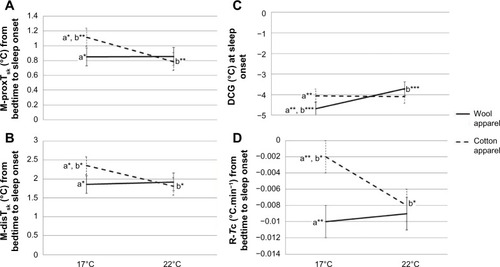
Table 4 Body temperature predictors of SOL and sleep stages (%N2 and %N3)
Table S1 Average sleep parameters for each condition (mean ± SD)
Table S2 Proximal and distal skin temperature and core body temperature at bedtime, sleep onset, its peak, and nadir