Figures & data
Table 1 Results of sleep questionnaire prior to polysomnography
Table 2 Patient characteristics and results of overnight PSG
Table 3 Odds ratio product during nocturnal polysomnography in current patients vs patients with mixed sleep disorders
Figure 1 Different patterns of evolution of ORP during naps.
Abbreviation: ORP, odds ratio product.
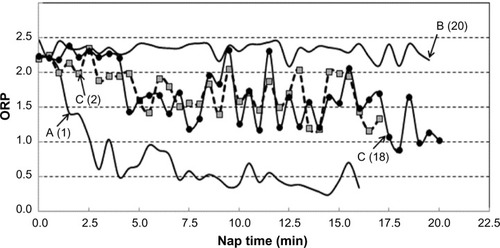
Figure 2 ORP at the time of manually determined sleep onset in 122 naps in which an onset was scored as a function of SOL.
Abbreviations: ORP, odds ratio product; NS, not significant; SOL, sleep onset latency.
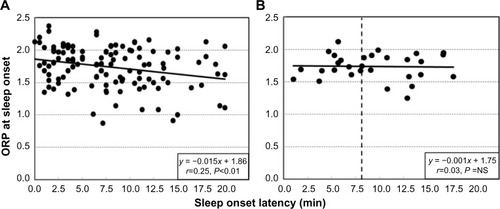
Figure 3 Examples of ORP patterns in naps with different ranges of SOLs.
Abbreviations: ORP, odds ratio product; SOL, sleep onset latency.
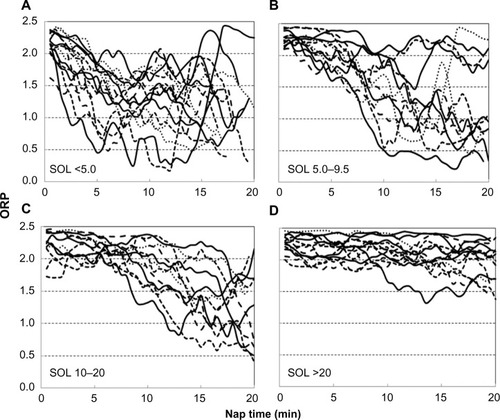
Table 4 Frequency and time of reaching different ORP levels (n=150)
Figure 4 Relation between average sleep onset latency and the deepest sleep reached during naps.
Abbreviation: ORP, odds ratio product; SOL, sleep onset latency.
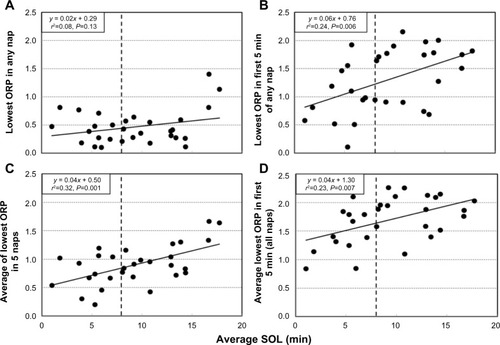
Table 5 SOL and ORP variables according to nap order
Figure 5 The lowest ORP reached in the first 5 minutes of the nap as a function of nap order.
Abbreviations: ORP, odds ratio product; SOL, sleep onset latency; SD, standard deviation.
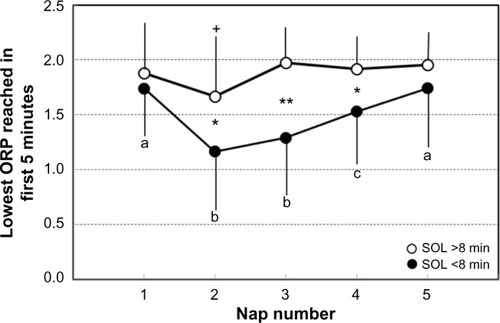
Table 6 SOL and ORP variables in naps with and without sleep perception
Table 7 SOL and ORP variables in patients with different frequencies of sleep perception
Figure 6 Frequency of sleep perception following naps as a function of the decrease in ORP.
Abbreviation: ORP, odds ratio product.
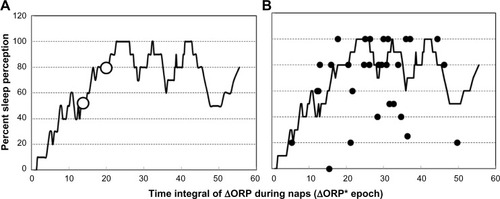
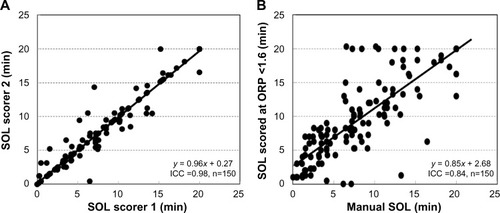
Figure 7 Agreement between scorers in scoring sleep onset latency.
Abbreviations: SOL, sleep onset latency; ORP, odds ratio product; ICC, intra-class correlation.