Figures & data
Table 1 Demographic and socioeconomic characteristics of male and female respondents
Table 2 Sleep variables on weekdays and weekends in males and females
Table 3 CES-D and GPA scores in males and females
Figure 1 Scatterplot presenting CES-D and cumulative GPA by sex.
Notes: There was a significant negative correlation between CES-D scores and average GPA in females (r=−0.278, P<0.01) but not in males, with lower GPA scores correlating with higher CES-D scores (higher incidence of depression).
Abbreviations: CES-D, Center for Epidemiological Studies Depression Scale; GPA, grade point average.
Abbreviations: CES-D, Center for Epidemiological Studies Depression Scale; GPA, grade point average.
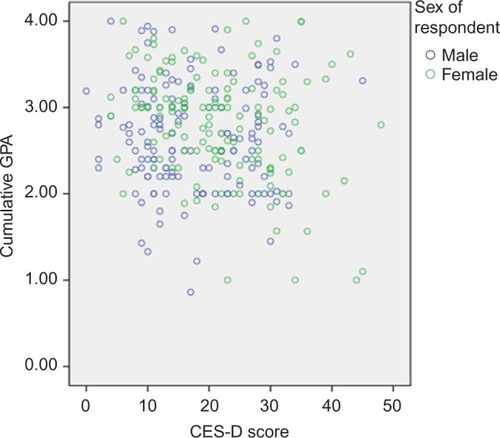
Table 4 Comparison of mean GPA among the three CES-D groups in males and females
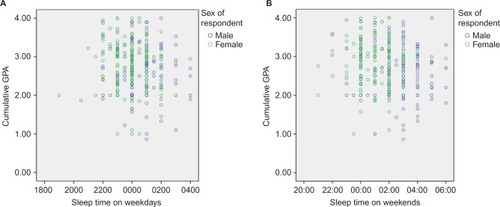
Figure 2 Scatter plot presenting sleep timing and cumulative GPA by sex on both weekdays (A) and weekends (B).
Notes: Sleep time is the hour according to the 24 hour clock. There was a significant negative correlation between bedtime and GPA in males (r=−0.159, P<0.05) on weekends but not weekdays. This indicated that later sleep times on weekends were significantly correlated with poorer academic performance in males.
Abbreviation: GPA, grade point average.
Abbreviation: GPA, grade point average.