Figures & data
Table 1 Classification of weight and apnea severity
Figure 1 The distribution of patients by sex, weight and apnea severity.
Abbreviations: BMI, body mass index; AHI, apnea hypopnea index.
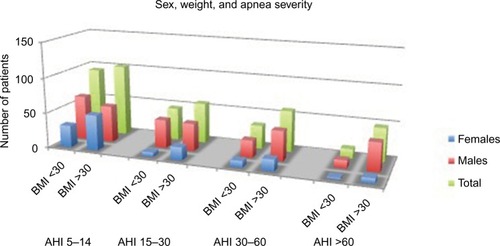
Figure 2 The distribution of patients by age and weight.
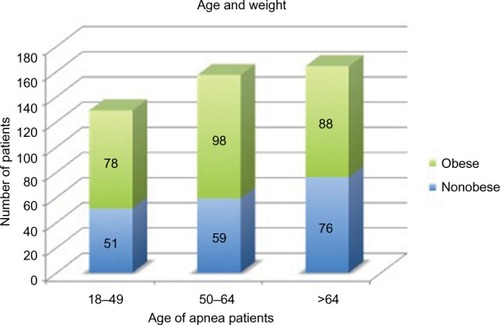
Table 2 Relation of weight to AHI
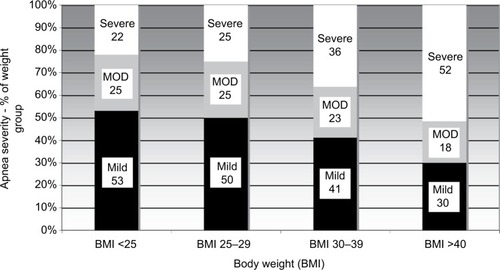
Figure 3 Columns represent the distribution of apnea severity for each weight group. Black represents the percentage of mild (AHI 5–14), gray represents moderate (MOD) (AHI 15–29), and white represents severe and very severe (AHI ≥30) apnea. The number of patients the distributions reflect are 45 (BMI <25), 141 (BMI 25–29), 204 (BMI 30–39), and 60 (BMI ≥40).
Abbreviations: BMI, body mass index; AHI, apnea hypopnea index.