Figures & data
Table 1 Normal data for mean and minimum overnight oxygen saturation and polysomnography variables in infants, children, and adults
Table 2 Highlights which anatomical landmarks were used by studies using MRI as the modality for measuring regions of interest
Table 3 Describes these studies found
Figure S1 (A) Adenoidal measurements. “A” represents distance from A1 point of maximal convexity, along inferior margin of adenoid shadow to line B,drawn along straight part of anterior margin of basiocciput. “A” is measured along line perpendicular from point A1 to its intersection with B. (B) Nasopharyngeal measurement. “N” is distance between C1 posterior superior edge of hard palate, and D1, anteroinferior edge of sphenobasiocciptal synchondrosis. When synchondrosis is not clearly visualised, point D1 can be determined as site of crossing posteroinferior margin of lateral pterygoid plates P and floor of bony nasopharyndx.
Note: Reprinted from Radiographic evaluation of adenoidal size in children: Adenoidal-nasopharyngeal ratio. Am J Roentgenol, Fujioka M, Young LW, Girdany BR, the American Journal of Roentgenology 133(3), Copyright© 1979, American Roentgen Ray Society.Citation52
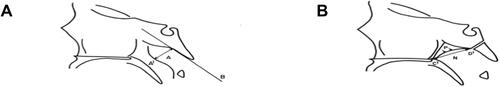
Figure S2 (A) Anatomical outlines of an axial T1 image at the level of the maximal tonsillar area of a control Subject. Transverse black arrow represents the intermandibular distance. (B) Anatomical outlines of a midsagittal T1 image of a control subject. Oblique black arrow represents the mental spine-clivus oblique distance.
Note: Reprinted with permission of the American Thoracic Society. Copyright © 2020 American Thoracic Society. Arens R, McDonough JM, Costarino AT, Mahboubi S, Tayag-Kier CE, Maislin G, et al. 2001. Magnetic resonance imaging of the upper airway structure of children with obstructive sleep apnea syndrome. Am J Respir Crit Care Med. 4. 698–703. Official journal of the American Thoracic Society.Citation47
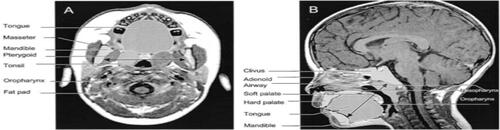
Figure S3 (A) T1-weighted axial image at the retropalated level (right) and segmented regions of interest (left) of a control subject. (B) Midsagittal T1-weighted image with mental spine-clivus distance shown (right) and segmented regions of interest (left) of a control subject.
Note: Reprinted with permission of the American Thoracic Society. Copyright © 2020 American Thoracic Society. Uong EC, McDonough JM, Tayag-Kier CE, Zhao H, Haselgrove J, Mahboubi S, et al. 2001. Magnetic resonance imaging of the upper airway in children with Down syndrome. Am J Respir Crit Care Med. 163. 731–736. Official journal of the American Thoracic Society.Citation73
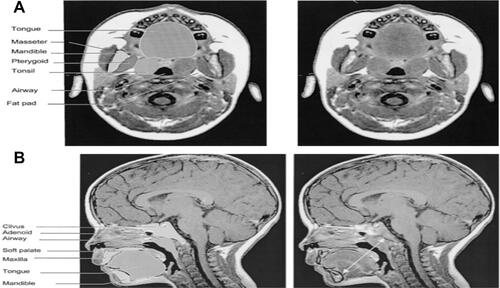
Figure S4 (A) Mid-sagittal T1-weighted image with mental spine-clivus oblique line shown (white line). Linear measurements were obtained along this line. (B) Axial T1-weighted image at the level of maximal tonsillar cross-sectional area. Note the transverse intermandibular line (white line) passing the center of each tonsil. Linear measurements were obtained along this axis. Maximal oropharyngeal width was obtained on this plane (dotted white line).
Note: Reprinted with permission of the American Thoracic Society. Copyright © 2020 American Thoracic Society. Arens R, McDonough JM, Corbin AM, Hernandez ME, Maislin G, Schwab RJ, et al. 2002. Linear dimensions of the upper airway structure during development: Assessment by magnetic resonance imaging. Am J Respir Crit Care Med. 165.117–22. Official journal of the American Thoracic Society.Citation121
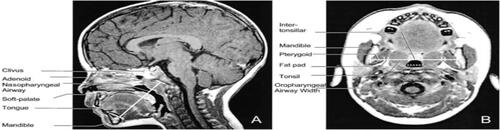
Figure S5 Left: three-dimensional display of an upper airway and its centerline in a subject with OSAS. Top right: gray-level two-dimansional scene of the cross-section of the airway orthogonal to the centerline at marker locations: A = adenoid; A + T = adenoid and tonsil overlap; T = tonsils; E = epiglottis. Bottom right: plot of the cross-sectional area function.
Note: Reprinted with permission of the American Thoracic Society. Copyright © 2020 American Thoracic Society. Arens R, McDonough JM, Corbin AM, Rubin NK, Carroll ME, Pack AI, et al. 2003. Upper airway size analysis by magnetic resonance imaging of children with obstructive sleep apnea syndrome. Am J Respir Crit Care Med. 167. 65–70. Official journal of the American Thoracic Society.Citation48
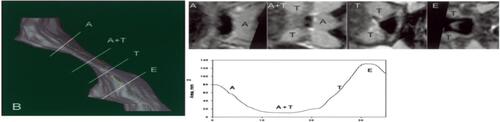
Figure S6 (A) Midsagittal magnetic resonance image (MRI) of a normal subject, demonstrating the upper airway regions: retropalatal (RP) — from the level of the hard palate to the caudal margin of the soft palate; and retroglossal (RG) — from the caudal margin of the soft palate to the base of the epiglottis. Soft palate, tongue, airway, mandible, and subcutaneous fat are denoted with arrows. Fat is bright (white) on an MRI. (B) Representative three dimensional upper airway volume in a patient with sleep apnea (left) and in a normal subject (right). Note that the upper airway volume is smaller in the RP region than in the RG region in both subjects and that the length of the total airway and the individual regions (RP/RG) is not equivalent between the apneic and normal subjects. Airway volume is smaller in the RP region in this apneic subject compared with the control subject; airway volume is similar in the RG region in this apneic subject compared with the control subject.
Note: Reprinted with permission of the American Thoracic Society. Copyright © 2020 American Thoracic Society. Schwab RJ, Pasirstein M, Pierson R, Mackley A, Hachadoorian R, Arens R, et al. 2003. Identification of upper airway anatomic risk factors for obstructive sleep apnea with volumetric magnetic resonance imaging. Am J Respir Crit Care Med. 168. 522–30. Official journal of the American Thoracic Society.Citation51
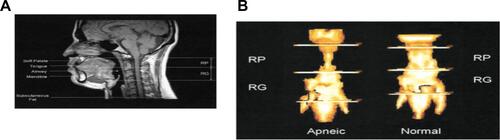
Figure S7 (A) Midsagittal magnetic resonance image demonstrating the four ascending levels for analysis (thick dotted lines). Level 1 is 4 mm above tip of epiglottis. (B) Dynamic changes in cross-sectional area at midtonsillar level (level 2) during tidal breathing (5-vol increments of inspiration [ins], 5-vol increments of expiration [Exp]) of control subjects (top panels) and subjects with OSAS (bottom panels). Note difference in anteroposterior (A-P) and lateral airway dimension.
Note: Reprinted with permission of the American Thoracic Society. Copyright © 2020 American Thoracic Society. Arens R, Sin S, McDonough JM, Palmer JM, Dominguez T, Meyer H, et al. 2005. Changes in upper airway size during tidal breathing in children with obstructive sleep apnea syndrome. Am J Respir Crit Care Med. 171. 1298–304. Official journal of the American Thoracic Society.Citation125
![Figure S7 (A) Midsagittal magnetic resonance image demonstrating the four ascending levels for analysis (thick dotted lines). Level 1 is 4 mm above tip of epiglottis. (B) Dynamic changes in cross-sectional area at midtonsillar level (level 2) during tidal breathing (5-vol increments of inspiration [ins], 5-vol increments of expiration [Exp]) of control subjects (top panels) and subjects with OSAS (bottom panels). Note difference in anteroposterior (A-P) and lateral airway dimension.Note: Reprinted with permission of the American Thoracic Society. Copyright © 2020 American Thoracic Society. Arens R, Sin S, McDonough JM, Palmer JM, Dominguez T, Meyer H, et al. 2005. Changes in upper airway size during tidal breathing in children with obstructive sleep apnea syndrome. Am J Respir Crit Care Med. 171. 1298–304. Official journal of the American Thoracic Society.Citation125](/cms/asset/77cba5aa-7b13-422c-b553-81fd499bb1df/dnss_a_12173981_sf0007_b.jpg)
Figure S8 Volumetric reconstructions from a series of 3-mm contiguous axial magnetic resonance (MR) images of the mandible (gray), tongue (orange/rust), soft palate (pink/purple), lateral parapharyngeal fat pads (yellow), and lateral/posterior pharyngeal walls (green) in a normal subject (top panel) and in a patient with sleep apnea (bottom panel). The upper airway is larger in the normal subject than in the patient with apnea. In addition, the tongue, lateral parapharyngeal fat pads, and lateral pharyngeal walls are larger in the patient with apnea.
Note: Reprinted with permission of the American Thoracic Society. Copyright © 2020 American Thoracic Society. Schwab RJ, Pasirstein M, Kaplan L, Pierson R, Mackley A, Hachadoorian R, et al. 2006. Family aggregation of upper airway soft tissue structures in normal subjects and patients with sleep apnea. Am J Respir Crit Care Med. 173. 453–63. Official journal of the American Thoracic Society.Citation145
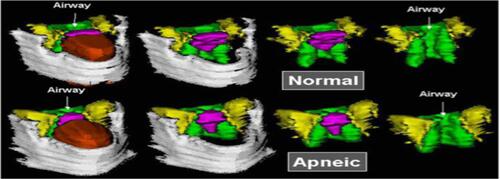
Figure S9 Upper airway, soft tissues, and mandibular reconstructions. Head and neck surface rensering with three-dimensional reconstructions of the upper airway, soft tissues, and mandible of a subject with obstructive sleep apnea syndrome in various views: lateral (top left), anterior oblique (bottom right). Airway (light blue), tongue (brown), mandible (white), nodes (red), and deep cervical nodes (green).
Note: Reprinted with permission of the American Thoracic Society. Copyright © 2020 American Thoracic Society. Arens R, Sin S, Nandalike K, Rieder J, Khan UI, Freeman K, et al. 2011. Upper airway structure and body fat composition in obese children with obstructive sleep apnea syndrome. Am J Respir Crit Care Med. 183. 782–787. Official journal of the American Thoracic Society.Citation49
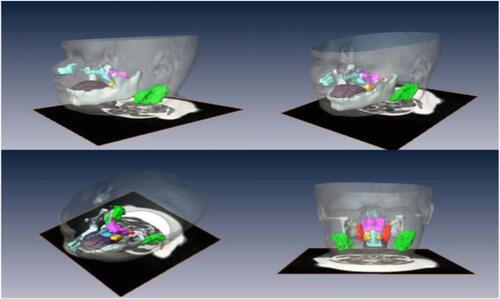
Figure S10 (A) CSA oropharyngeal airway. (B) Combined upper airway volume, T1 weighted axial scan. (C) Transverse line perpendicular to the floor passing through the hyoide to nasion, to sella to supramentale. (D) Midsagittal palatal CSA.
Note: Reprinted from Int J Pediatr Otorhinolaryngol, 77(1), Cappabianca S, Iaselli F, Negro A, et al., Magnetic resonance imaging in the evaluation of anatomical risk factors for pediatric obstructive sleep apnoea-hypopnoea: a pilot study, 69–75, Copyright 2013, with permission from Elsevier.Citation124
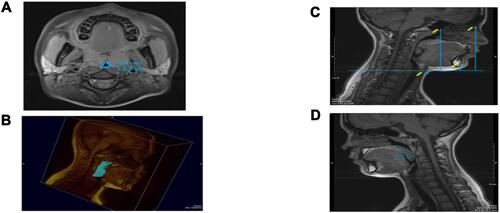
Figure S11 (A) Left 4 images. Mid sagittal (top) and axial T2-weighted images at the level of the nasopharynx (bottom), of a patient before (left) and after (right) adenotonsillectomy. Solid white arrows indicate adenoid tissue (gray) and dotted arrows indicate nasopharyngeal airway.Note residual adenoidal tissue and larger airway after adenoidal tissue and larger airway after adeniodectomy. In this example, a 29% reduction in adenoid volume was noted on MRI. (B) Right 2 images. Axial T2-weighted images at the level of the oropharynx of a patient before (left) and after (right) adenotonsillectomy. Solid white arrows indicate tonsillar tissue (gray) and dotted arrows indicate oropharyngeal airway. Note the larger airway and small left residual tonsil tissue after tonsillectomy.
Note: Reprinted from CHEST, 142(1), Strauss T, Sin S, Marcus CL, Mason TBA, McDonough JM, Allen JL, et al., Upper airway lymphoid tissue size in children with sickle cell disease, 94-100, Copyright 2012, with permission from Elsevier.Citation50
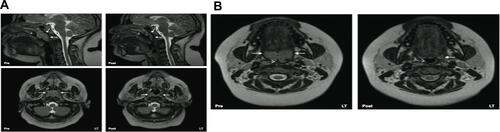
Figure S12 MRI volumetric analysis of lymphoid tissue volumes in an OSA patient (green-upper jugular lymph nodes, orange-tonsil tissue, red-retropharyngeal lymph nodes, magenta-adenoid tissue). (A) Three dimensional reconstruction of lymphoid tissue using Amira® software. (B) Axial T2-weighted DICOM image with lymphoid tissue tracings. (C) Coronal T2-weighted DICOM image with lymphoid tissue tracings. (D) Sagittal T2-weighted DICOM image with lymphoid tissue tracings.
Note: Nandalike K, Shifteh K, Sin S, Strauss T, Stakofsky A, Gonik N et al., Adenotonsillectomy in obese children with obstructive sleep apnoea syndrome: magnetic resonance imaging findings and considerations, SLEEP, 2013, 36, 6, 841-847, by permission of Oxford University Press.Citation146
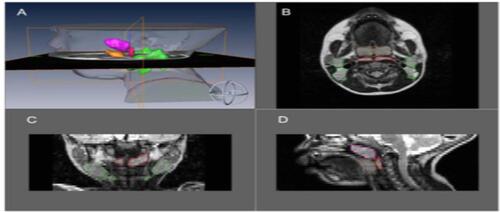
Figure S13 Upper airway, soft tissues, and mandibular reconstructions. Head and neck surface rendering with three-dimensional reconstructions of the upper airway, soft tissues, and mandible of a subject with obstructive sleep apnea syndrome in various views:lateral (top left), anterior oblique (top right), superior oblique (bottom left) and posterior (bottom right). Airway (light blue), tongue (brown), mandible (white), soft palate (blue), tonsils (yellow), adenoid (magenta), retropharyngeal nodes (red), and deep cervical nodes (green).
Note: Copyright ©2003. John Wiley and Sons. Reproduced from Parikh SR, Sadoughi B, Sin S, Willen S, Nandalike K, Arens R. Deep cervical lymph node hypertrophy: A new paradigm in the understanding of pediatric obstructive sleep apnea. Laryngoscope. 2013;123(8):2043–9.Citation123
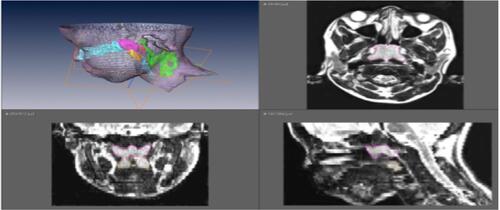
Figure S14 Anatomical definitions of upper airway landmarks on midsaggital and axial slices with 3D reconstruction of regions of interest.
Note: Reprinted with permission of the American Thoracic Society. Copyright © 2020 American Thoracic Society. Schwab RJ, Kim C, Bagchi S, Keenan BT, Comyn FL, Wang S et al. 2015. Understanding the anatomic basis for obstructive sleep apnea syndrome in adolescents. Am J Resp Crit Care Med. 191. 1295-1309. Official journal of the American Thoracic Society.Citation147
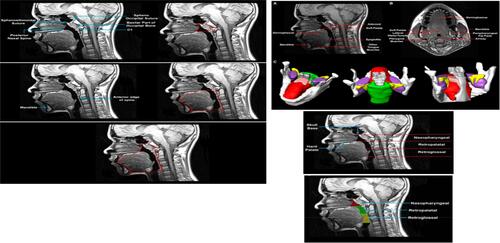
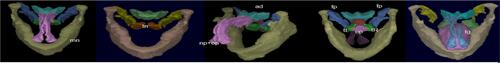
Figure S15 3D surface renditions of objects: np (nasopharynx), op (oropharynx), mn (mandible), tn (tonsils), tL & tR (left and right (tonsil), fp (fat pad), ad (adenoid), tg (tongue).
Note: Copyright ©2016. PLoS One. Reproduced from Capovilla G, Beccaria F, Montagnini A, et al. Tong Y, Udupa JK, Sin S, Liu Z, Wileyto EP, Drew A et al. MR Image Analytics to Characterize the Upper Airway Structure in Obese Children with Obstructive Sleep Apnea Syndrome. PLoS One 2016; 11(8):e0159327.Citation148